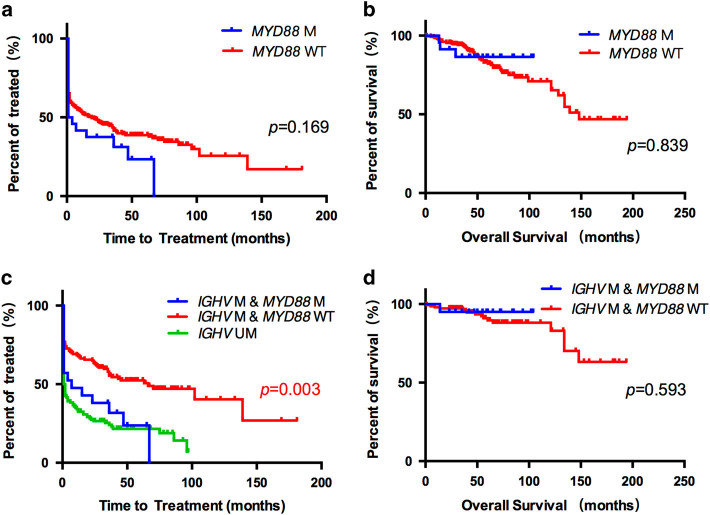
Fig. 1.
a Kaplan-Meier estimates of TTT according to MYD88 mutation status among all patients. Time to treatment analysis according to MYD88 mutation status in the CLL patients (N = 284). MYD88 wild-type cases (MYD88 (-)) are represented by the red line. MYD88 mutated cases (MYD88 ( + )) are represented by the blue line. b Kaplan-Meier estimates of OS according to MYD88 mutation status among all patients. Overall survival analysis according to MYD88 mutation status in the CLL patients (N = 284). MYD88 wild-type cases (MYD88 (-)) are represented by the red line. MYD88 mutated cases (MYD88 ( + )) are represented by the blue line. c Kaplan-Meier estimates of TTT according to MYD88 mutation status and IGHV mutation status among M-CLL patients. Time to treatment analysis according to MYD88 mutation status and IGHV mutation status among all CLL patients (N = 284). Of the M-CLL cases, MYD88 wild-type cases (IGHV ( + ) MYD88 (-)) are represented by the red line, while MYD88 mutated cases (IGHV ( + ) MYD88 ( + )) are represented by the blue line. IGHV unmutated cases (IGHV(-)) are represented by the green line. d Kaplan-Meier estimates of OS according to MYD88 mutation status among M-CLL patients. Overall survival analysis according to MYD88 mutation status in the M-CLL patients (N = 165). MYD88 wild-type cases (IGHV ( + ) MYD88 (-)) are represented by the red line. MYD88 mutated cases (IGHV ( + ) MYD88 ( + )) are represented by the blue line

