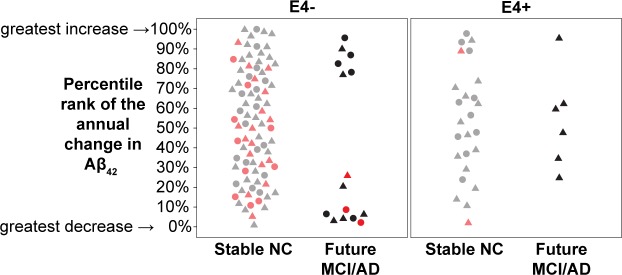
Fig 5. Percentile rank of the annual percent change in Aβ42 (ε4 genotype and outcome group).
The percentile rankings (by cohort) of the annual percent change in Aβ42 are shown on the y-axis. The subjects are split by E4 carrier status on the x-axis then by Outcome group which is indicated with gray markers for stable NC with baseline Aβ42 levels below the 75th percentile and light red for those above and black for Future MCI/AD with baseline Aβ42 levels below the 75th percentile and red for those above. NYU subjects are represented as circles and ADNI as triangles.

