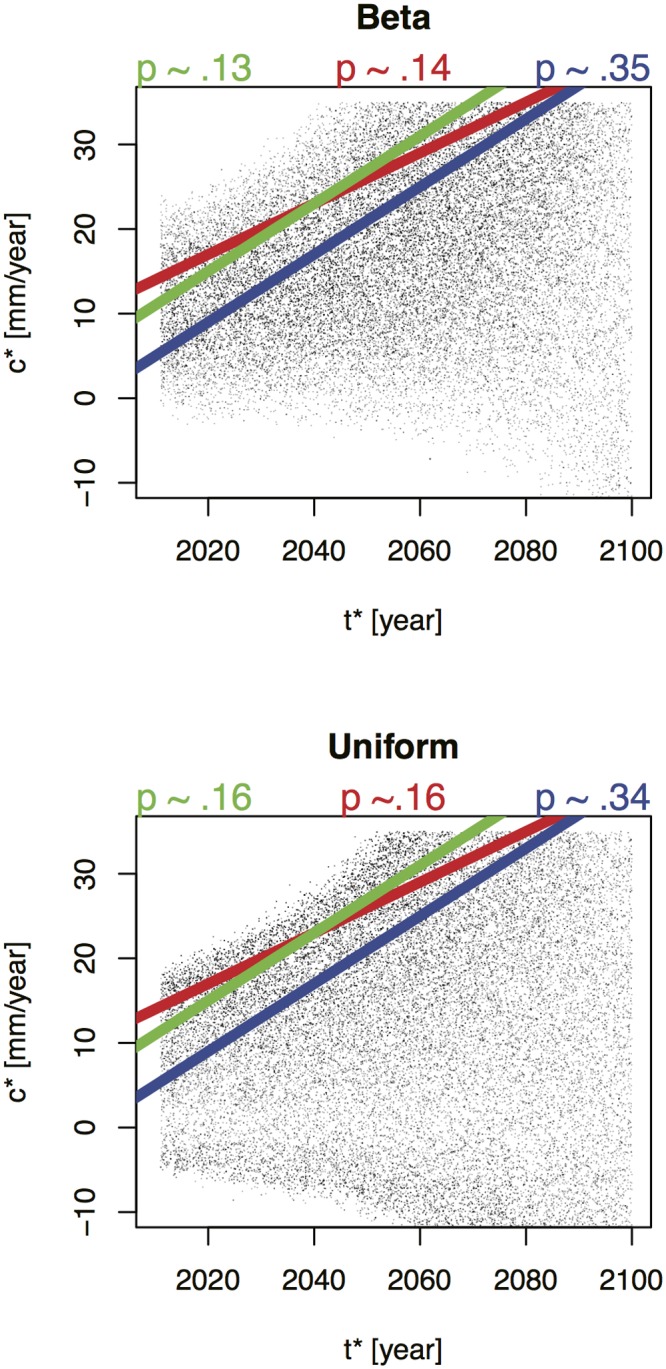
Fig 9. The red line shows estimates of the likelihood of the first condition describing the Harden at Next Upgrade scenario using the: (a) Beta distribution fit to the extended projections of Pfeffer et al. [24] and (b) the uniform distribution fit to the projections of CO-CAT [88] shown in Fig 8.

Dots represent c*/t* pairs that are jointly sampled (along with polynomial parameters a, b, and c) based on the idealized sea-level rise projections (represented as beta and unform distributions). Green and blue lines show an analogous condition for two other Port of LA facilities, Berths 206–209 and Alameda and Harry Bridges Crossing, respectively.
