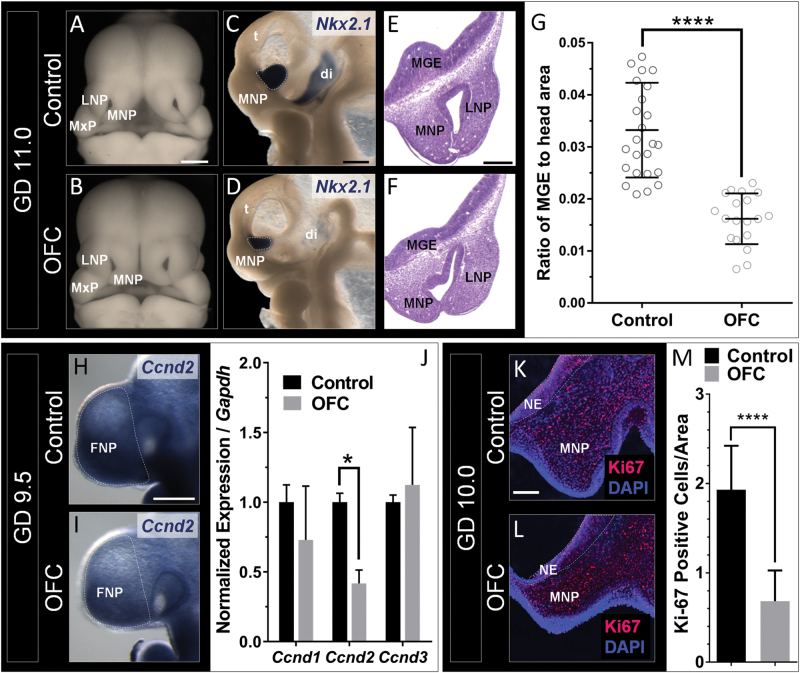
Fig. 3.
Disrupted MGE development parallels OFC pathogenesis. Deficiency of the MNPs and MGEs in the OFC group is shown in whole embryos (a,b) and hemisected embryos stained for Nkx2.1 (c,d). e,f The anatomical relationship and paralleled hypoplasia of the MNPs and MGEs is shown by histological staining of transverse sections. g Quantification of MGE area relative to total head area (Fig. S2) was calculated from images depicted in c and d. Individual data points are shown with mean±s.d. of n = 24 embryos from three litters for the control group and n = 19 embryos from three litters for the OFC group; ****P ≤ 0.0001, two-tailed Student’s t-test. Reduced expression of Ccnd2 in the OFC group is shown by ISH staining (h,i) and RT-PCR analysis of microdissected FNP tissue of GD9.5 embryos (j). Values represent mean±s.e.m. of n = 3 pooled litters per group; *P ≤ 0.05, two-tailed Student’s t-test. Staining on frontal sections through the neuroectoderm (NE) of GD10.0 embryos (k,l) demonstrated a reduction in the number of Ki67-positive cells per total area in the OFC group. Values represent the mean±s.e.m.; ****P ≤ 0.0001, two-tailed Student’s t-test. LNP lateral nasal process, MNP medial nasal process, t telencephalon, di diencephalon

