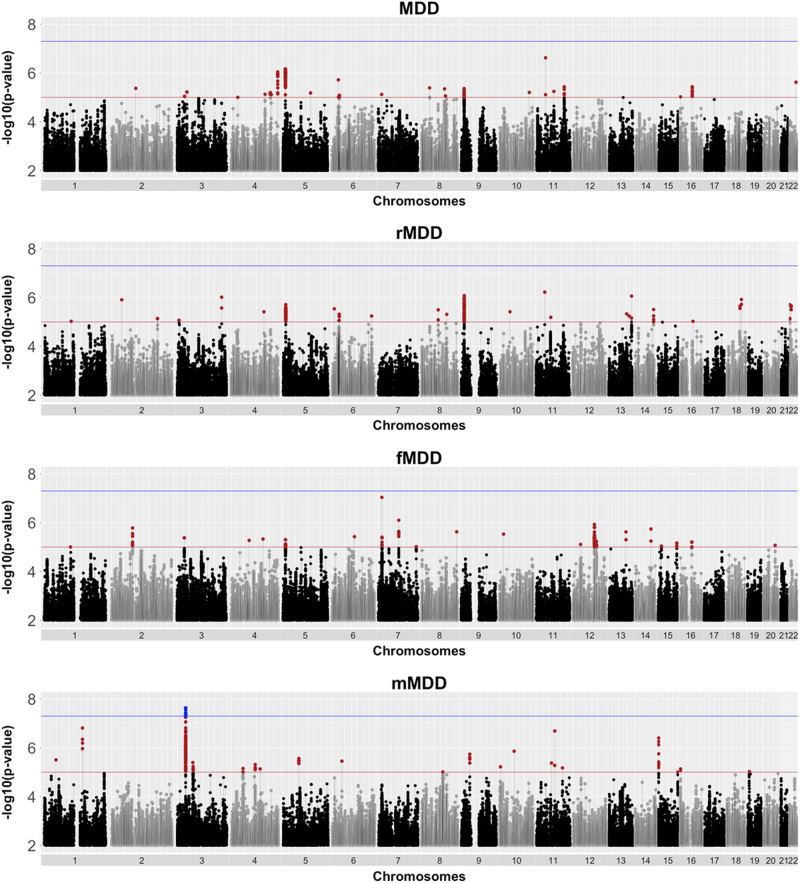
Fig. 1.
Manhattan plot of P-values from SNP-based association meta-analysis of all depression cases and controls (MDD, n = 43 062), recurrent only cases and all controls (rMDD, n = 39 556), females only cases and controls (fMDD, n = 23 169) and males only cases and controls (mMDD, n = 19 886). The blue line indicates the threshold for genome-wide significance (P < 5 × 10⁻⁸), the red line indicates the threshold for suggestive significance (P < 1 × 10⁻⁵)

