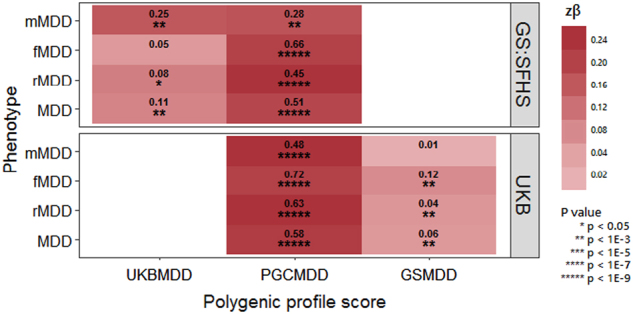
Fig. 4.

Heat map of associations between the polygenic profiles scores (PGS) for major depressive disorder (MDD), derived from Psychiatric Genomics Consortium (PGC) MDD29, UK Biobank (UKB) and Generation Scotland: The Scottish Family Health Study (GS:SFHS), and MDD subsets in UKB and GS:SFHS. Stronger associations are indicated by darker shades. The amount of variance (%) explained by PGS is indicated for each association. Further information can be found in Supplementary Tables 15-18
