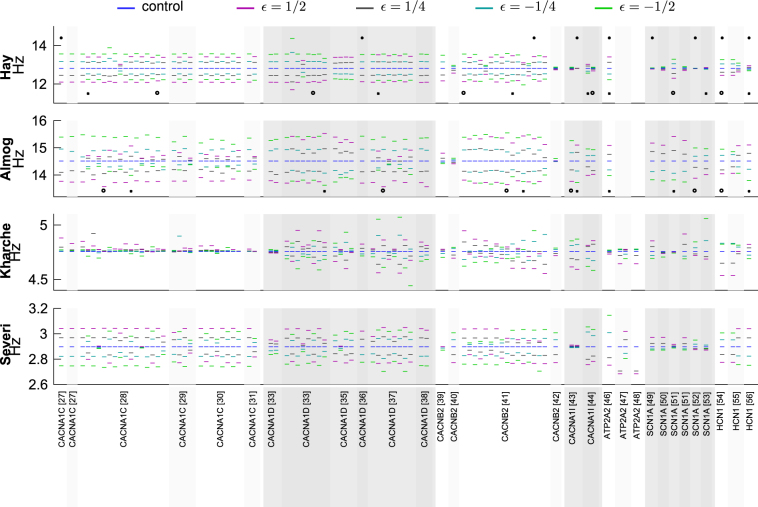
Fig. 3. Overview of variant effects on L5PC firing and SANC pacemaking.
The average firing frequencies and pacemaking rhythms are shown for all variants of Supplementary Table S2. Top panel: Firing rates in the Hay model, averaged over stimulus amplitudes 0.35–1.4 nA. Second panel: Firing rates in the Almog model, averaged over stimulus amplitudes 0.7–0.9 nA. Third panel: Pacemaking rates in the Kharche model. Bottom panel: Pacemaking rates in the Severi model. See Figs. 1 and 2 for more detailed data. Variants shown in Figs. 1 and 2 are highlighted with asterisks, and variants used in combinations of Supplementary Fig. S10 are highlighted with crosses (' × ') and circles (' ∘ ')

