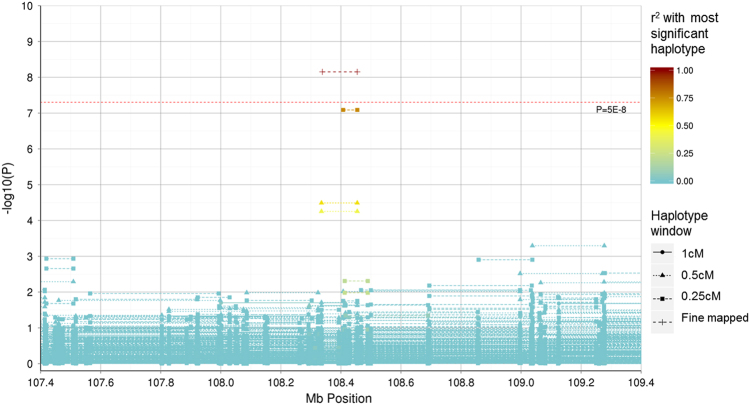
Fig. 2.
Regional association plot representing the –log10 P-values for an association between haplotypes in the Generation Scotland: Scottish Family Health Study cohort and Major Depressive Disorder within the 107.4–107.6 Mb region on chromosome 6. The start and end position (using build GRCh37) of haplotypes represent the outermost SNP positions within the windows examined. The warmth of colour represents the r 2 with the genome-wide significant haplotype located between 108,338,267 and 108,454,437 bp

