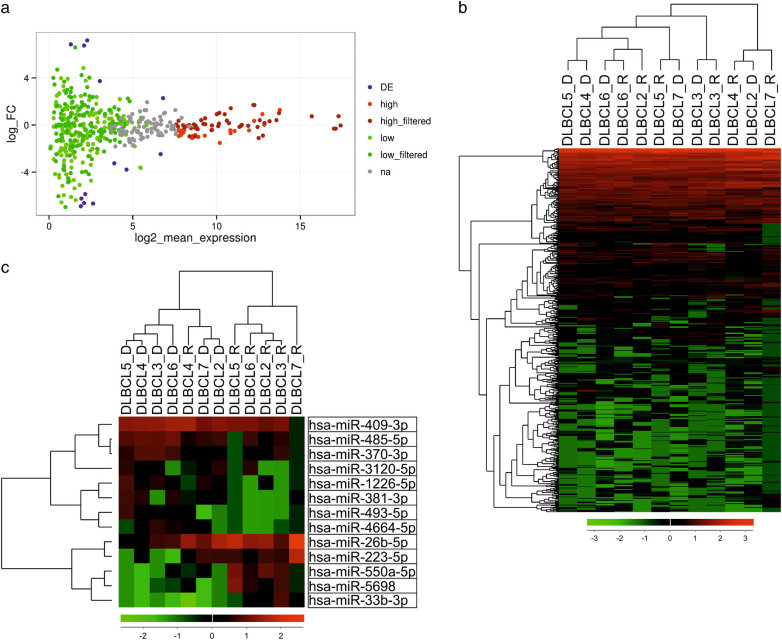
Fig. 1. MiRNA-sequencing results.
Seven primary-relapse DLBCL sample pairs were subjected to next-generation miRNA sequencing. One relapse sample (DLBCL1_R) was exluded from the analyses because it failed the quality control. Therefore, the paired analyses included data from six pairs. a MA (Log ratio (M) vs. mean average (A) expression) plot visualizing miRNA expression in primary and relapse sample pairs. The colors denote different subgroups of miRNAs: differentially (DE), high and low expressed (high and low expressed miRNAs were filtered against a reference data set from normal and non-malignant B-cells, as described in Methods). b A heatmap visualizing clustering of the DLBCL samples based on their miRNA expression. c A heatmap of miRNAs differentially expressed between primary and relapse pairs with p-value < 0.05. FC fold change, na not assigned

