Fig. 2.
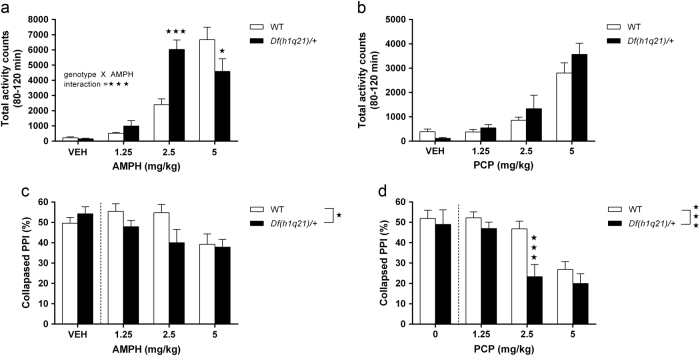
Psychostimulant-induced behavioral alterations in Df(h1q21)/+ mice. a Horizontal activity following amphetamine (AMPH) treatment (0–5 mg/kg). Genotype × treatment interaction, F3,88 = 11.15, p < 0.001, n = 11–12/group. For full time curve see Supplementary Fig. S3A. b Horizontal activity following phencyclidine (PCP) treatment (0–5 mg/kg). n = 12/group. No significant differences between genotypes. For full time curve see Supplementary Fig. S3B. c Prepulse inhibition (PPI) following AMPH treatment. Effect of genotype, F 1,64 = 4.50, p < 0.05, n = 11–12/group. d Prepulse inhibition (PPI) following PCP treatment. Effect of genotype, F 1,61 = 12.05, n = 10–12/group. Data sets were analyzed by two-way ANOVA with post hoc comparisons using Bonferroni correction where appropriate. Stars in the upper right corner of figures represent main effect of genotype, while stars above columns represent Bonferroni-corrected post hoc tests. Data presented as means ± SEM. * p < 0.05; *** p < 0.001 vs. wild types. Dotted lines in c, d symbolize exclusion of vehicle-treated animals from statistical analyses (see Results section)

