Fig. 3.
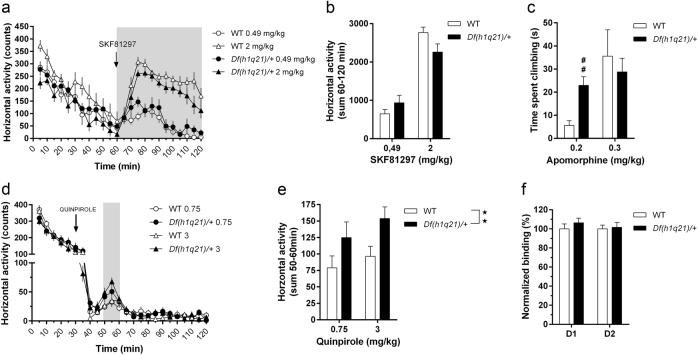
D1-dependent and D2-dependent changes in Df(h1q21)/+ mice. a Horizontal activity (in 5 min bins) following treatment with D1 agonist SKF-81297 (0.49 and 2 mg/kg). n = 7–8/group. Shaded area representing bins used for quantification. b Horizontal activity summary for 60–120 bins in (a). c Climbing duration following two doses of apomorphine (0.2 and 0.3 mg/kg). ## p < 0.01 following Mann–Whitney test with Bonferroni correction. d Horizontal activity (in 5 min bins) following treatment with D2 agonist quinpirole (0.75 and 3 mg/kg). n = 7–8/group. e Horizontal activity summary for 50–60 bins in (d; effect of genotype following mixed model ANOVA). f Normalized D1-specific and D2-specific binding using striatal membranes. n = 11–12/group. Stars above columns represent post hoc tests and stars in the upper right corner of figures represent main effect of genotype. Data presented as means ± SEM. ** p < 0.01

