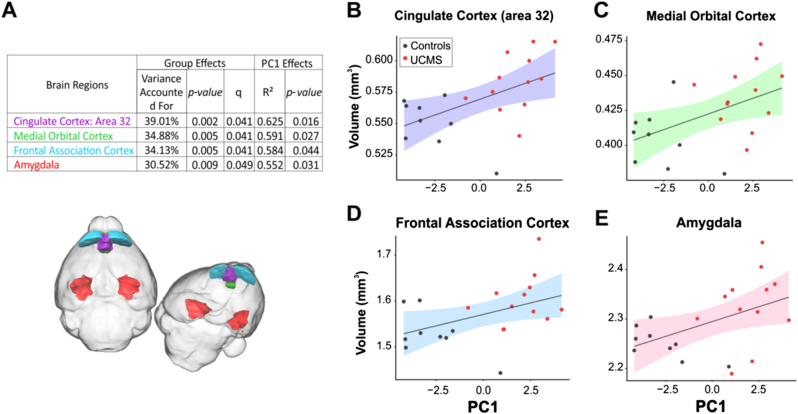
Fig. 2. Four brain regions showed UCMS-induced changes in volumes that positively correlated with behavioral emotionality.
a Table summarizes group and PC1 significant effects for each brain region significantly affected by UCMS, including variance accounted for, p values, q value following FDR correction for group effect on regional volume, and r2 and p values for correlation between volume and behavioral emotionality assessed by PC1. The four regions are similarly color-coded in the table and brain overlay figure. b–e Scatterplots depicting the significant positive correlation between behavioral emotionality (PC1) and brain volume for (b) cingulate area 32 (prelimbic cortex), (c) medial orbital cortex, (d) frontal association cortex, (e) amygdala. Colored bands represent 95% confidence intervals

