Fig. 1.
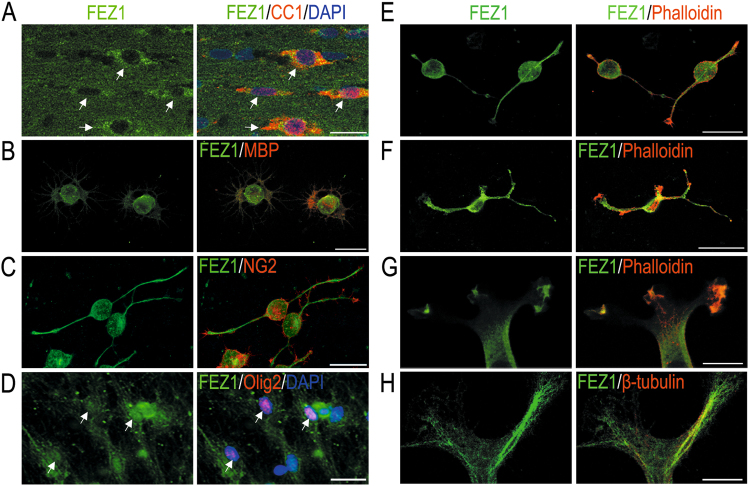
Expression and subcellular localization of FEZ1 in OL lineage cells. a–d Representative immunofluorescent images of FEZ1 (green) with OL markers (red) for different developmental stages. a Mature oligodendrocytes in the mouse corpus callosum marked by CC1; b primary cultured mature rat oligodendrocyte marked by MBP; c rat OPCs marked by NG2; and d human iPSC-derived OL marked by Olig2. e, f Enrichment of FEZ1 (green) in the enlarged distal tips of primary rat OPCs (e) and the OPC cell line CG4 (f). The leading edge is marked by phalloidin that stains F-actin (red). g A representative image for colocalization of FEZ1 (green) and phalloidin (red) in distal tips of CG4 processes. h Double-staining of FEZ1 (green) and β-tubulin (red) in CG4 processes. Scale bar in (a–e) 20 μm. Scale bar in F = 40 μm. Scale bar in (g, h) 10 μm

