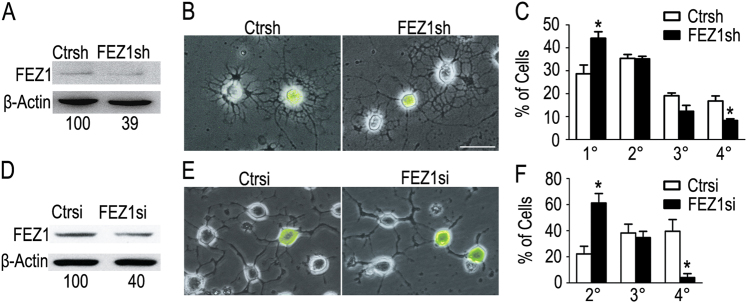
Fig. 3.
Knockdown of FEZ1 reduces the growth of OL processes. a Representative immunoblot of FEZ1 protein in primary OPCs treated by a lentivirus expressing control shRNA (Ctrsh) or FEZ1 shRNA (FEZ1sh). Densitometer readings of FEZ1 signal normalized to the loading reference β-actin are displayed underneath. b Representative images of primary OPCs treated with control shRNA or FEZ1 shRNA that underwent 72 h of differentiation. EGFP is expressed by the lentivirus for identification of infected cells. c Quantitative analysis of morphology of rat primary OPCs. Percentages of cells that harbor the highest order of process branches as primary (1°), secondary (2°), tertiary (3°), and quaternary (4°) were calculated. Data are expressed as mean ± SEM of three independent experiments (n = 353 cells in control shRNA, n = 390 cells in FEZ1 shRNA). d Representative immunoblot of FEZ1 protein in CG4 cells treated with control siRNA (Ctrsi) or FEZ1 siRNA (FEZ1si). Densitometer readings of FEZ1 signal normalized to the loading reference β-actin are displayed underneath. e Representative images of CG4 cells transfected with control siRNA or FEZ1 siRNA that underwent 48 h of differentiation. EGFP marks co-transfected cells. f Quantitative analysis of CG4 cell morphology as described in (c; n = 123 for each group). Scale bar = 20 μm

