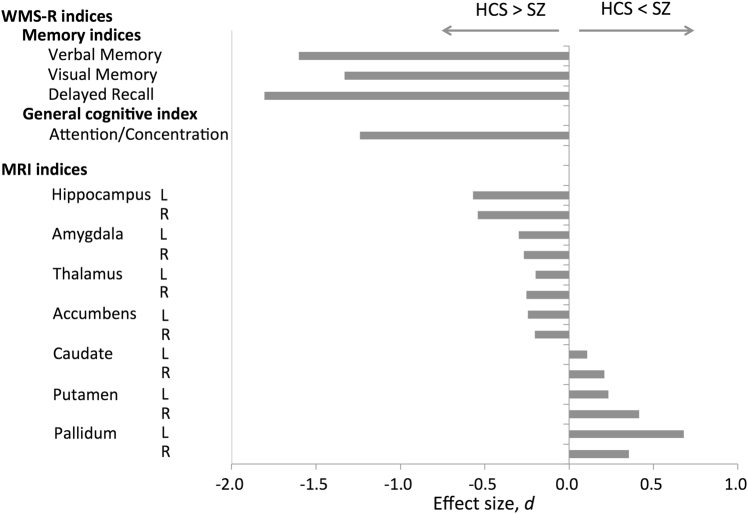
Fig. 1. Cohen’s d effect sizes for differences in the WMS-R and MRI indices between patients with schizophrenia and HCS.
The vertical axis represents the WMS-R and MRI indices. The horizontal axis represents Cohen’s d effect sizes for difference in the WMS-R and MRI indices between patients with schizophrenia and HCS. WMS-R Wechsler Memory Scale-Revised, MRI magnetic resonance imaging, L left, R right, SZ patients with schizophrenia group, HCS healthy comparison subjects group

