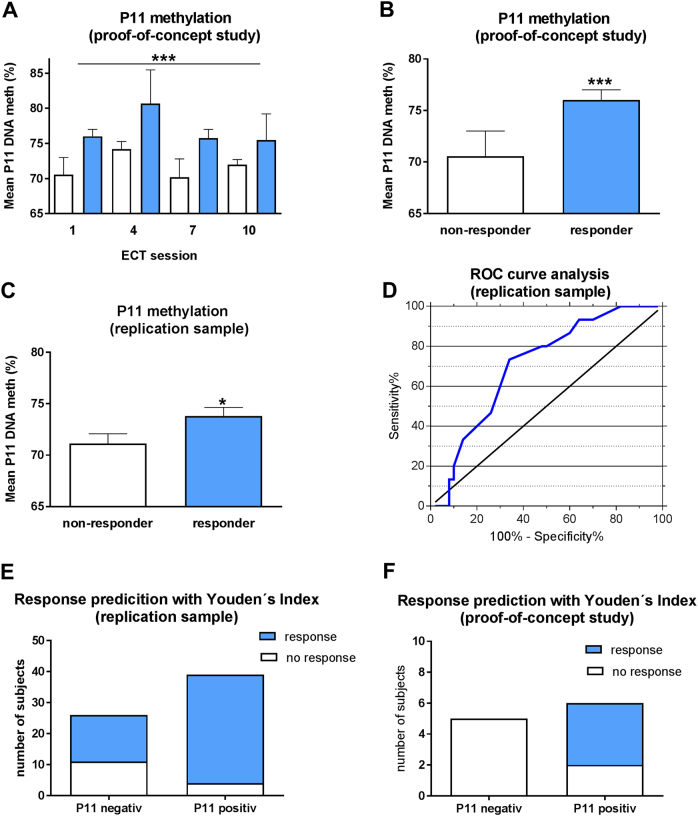
Fig. 5.
Association between clinical response to ECT and p11 promoter methylation. Data are shown as means ± SEM; significant differences between groups are indicated by asterisks (*P < 0.05; **P < 0.01; ***P < 0.0001). As shown in a and b, p11 promoter methylation was higher in responders (n = 4) compared with nonresponders (n = 6) directly before ECT sessions 1, 4, 7, and 10 (response: P < 0.0001; ECT-number: P = 0.094, derived from mixed linear modelling including the factors age and gender). c Higher baseline p11 promoter methylation of responders (n = 50) compared with nonresponders (n = 15) to ECT in the independent clinical replication sample (P = 0.014, derived from mixed linear modelling including the factors age and gender). d ROC curve analysis to evaluate the efficiency of p11 promoter methylation levels in differentiating responders fron nonresponders in the independent clinical replication sample with area under the curve values (AUC) of 0.711 (95% CI: 0.575–0.846; P = 0.006). Values of above the threshold of 72.15% (derived from Youden’s Index) were robust to discriminate responders from nonresponders with a sensitivity of 70% and specifity of 73% as shown in e. P11 hypermethylation predicted ECT response with a probability of 89%. f The derived cutoff from Youden’s Index was sufficient to distinguish responders (all above the threshold of 72.15%) from nonresponders in the POC study (P = 0.045)

