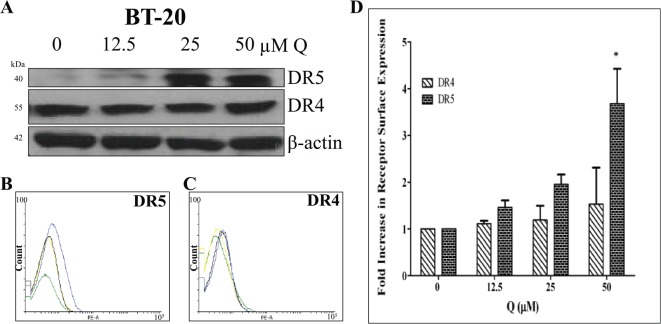
Figure 6.
DR4 and DR5 expression in Q-treated breast cancer BT-20 cells. (A) DR4 and DR5 (mature form) protein levels were assessed after 72 hours of treatment; Q upregulated DR5 expression in a dose-dependent manner. (B) DR5 and (C) DR4 cell surface expression levels for Q-treated BT-20 cells were analyzed by flow cytometry. For the representative histograms (B) and (C), vehicle-treated control = green, 12.5 µM Q = yellow, 25 µM Q = black, and 50 µM Q = blue. (D) The bar graphs represent the average fold increase in DR4 or DR5 cell surface expressions relative to the vehicle-treated control ± SEM from 3 independent experiments performed in triplicate (n = 9). P > .05 except *. Q indicates quercetin.

