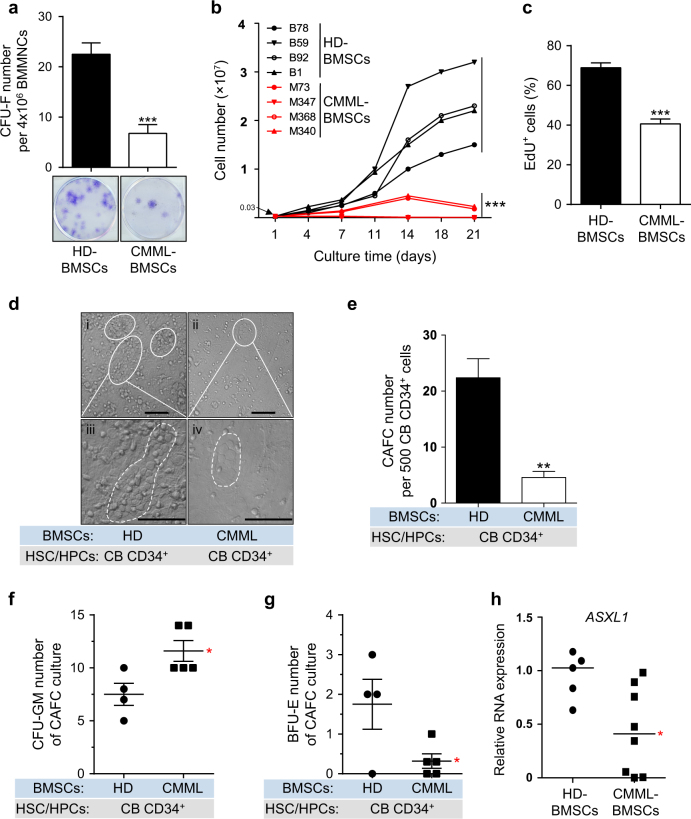
Fig. 1. CMML-BMSCs exhibit decreased proliferative capacity and reduced hematopoietic supportive activity.
a The frequency of CFU-F from CMML patients shows a dramatically decreased BMSC pool compared with HD controls after 10 days of culture (n = 5 individual samples for each group). Representative photographs of CFU-F are shown. b Growth curves for 21 days shows reduced proliferation ability of CMML-BMSCs (red lines, n = 4) compared with HD-BMSCs (black lines, n = 4). Each dot represents one passage. c Bar graph shows the percentage of EdU+ cells (n = 4 individual samples for HD, 3 for CMML). d Long-term co-culture of CB CD34+ cells with CMML-BMSCs or HD-BMSCs indicates impaired hematopoietic supportive ability of CMML-BMSCs. Representative micrographs of CAFCs after 5 weeks of co-culture with HD-BMSCs (i, iii) or CMML-BMSCs (ii, iv) are shown. Scale bar, 50 µm. e The numbers of CAFC are reduced in CB CD34+ cells co-cultured with CMML-BMSCs. Quantitative evaluation of CAFC number per 500 CB CD34+ cells is shown (n = 4 individual samples for HD, 5 for CMML). f, g After co-culture of CB CD34+ cells with HD-BMSCs or CMML-BMSCs, the CFU-C assays were performed. The colony numbers of CFU-GM (f) and BFU-E (g) are shown (n = 4 individual samples for HD, 5 for CMML). h qPCR analysis shows that ASXL1 transcripts were significantly decreased in CMML-BMSCs compared with HD-BMSCs (n = 5 individual samples for HD, 8 for CMML). Bars represent the median. Data represent mean ± s.e.m., * P < 0.05. **P < 0.01, ***P < 0.001

