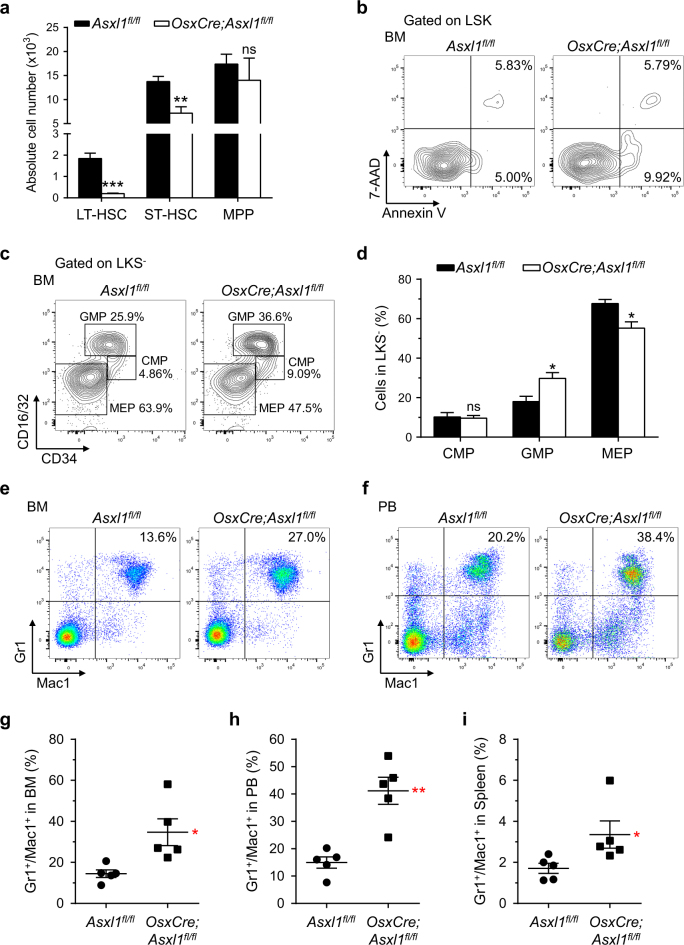
Fig. 2. Altered HSC/HPC and myeloid populations in OsxCre;Asxl1fl/fl mice.
a Absolute numbers of LT-HSCs, ST-HSCs, and MPP cells are shown (n = 4 mice per genotype). b Apoptosis analysis (Annexin V/7-AAD staining) on freshly isolated LSK cells from BM of representative Asxl1fl/fl and OsxCre;Asxl1fl/fl mice. c Flow cytometric analysis of CMP, GMP, and MEP populations in the Lin−cKit+Scal1− (LKS−) cells from BM of representative Asxl1fl/fl and OsxCre;Asxl1fl/fl mice. d Quantification of the percent GMP and MEP populations in LKS− cells of OsxCre;Asxl1fl/fl mice are shown (n = 4 mice per genotype). e, f Flow cytometric analysis of Gr1+/Mac1+ cell populations in BM (e) and PB (f) of representative Asxl1fl/fl and OsxCre;Asxl1fl/fl mice. g–i Quantification of Gr1+/Mac1+ cell populations in BM (g), PB (h), and spleen (i) revealed increased granulocytic/monocytic cells in OsxCre;Asxl1fl/fl mice (n = 5 mice per genotype). Data represent mean ± s.e.m., ns, not significant, *P < 0.05, **P < 0.01, ***P < 0.001

