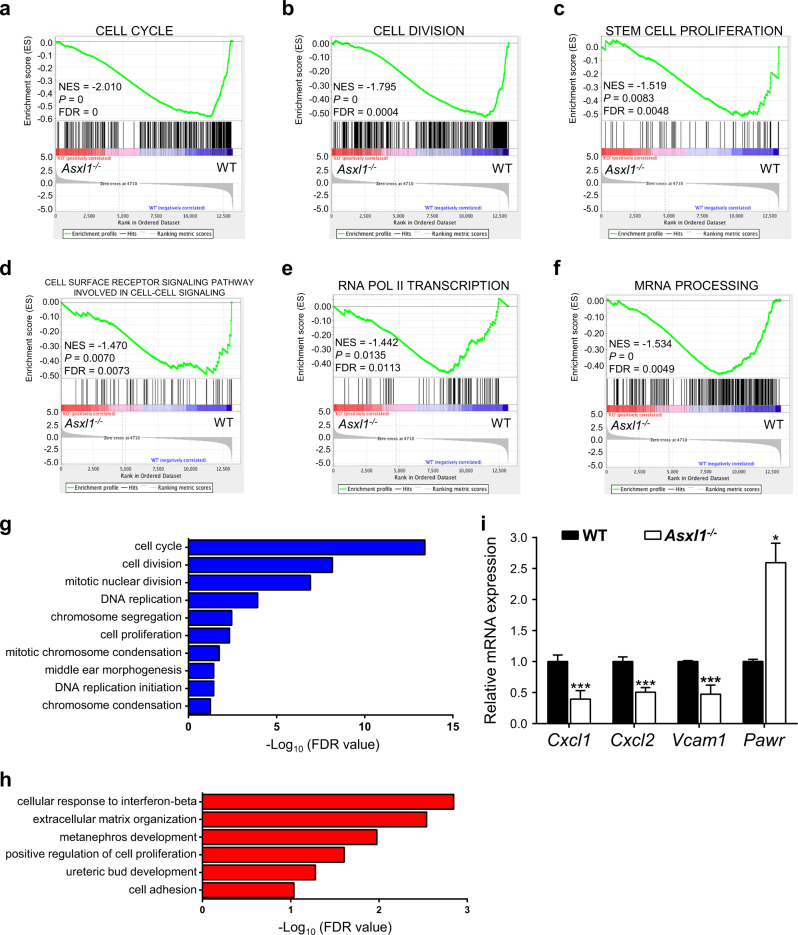
Fig. 4. Loss of Asxl1 in BMSCs alters the expression of genes associated with the HSC/HPC maintenance.
a–f GSEA plots showing downregulated genes in Asxl1−/− BMSCs significantly enriched in the cell cycle (a), cell division (b), stem cell proliferation (c), cell surface receptor signaling pathway involved in cell–cell signaling (d), and mRNA transcription (e, f) signature. The normalized enrichment score (NES), P-value and false discovery rate (FDR) are shown. g, h GO analysis of the down- (g, blue) and up- (h, red) regulated genes in Asxl1−/− BMSCs compared with WT cells (FDR < 0.1). i qPCR shows dysregulated genes expression in Asxl1−/− BMSCs compared with WT BMSCs (n = 3~5 mice for WT, n = 4~6 mice for Asxl1−/−). Data represent mean ± s.e.m., *P < 0.05, ***P < 0.005

