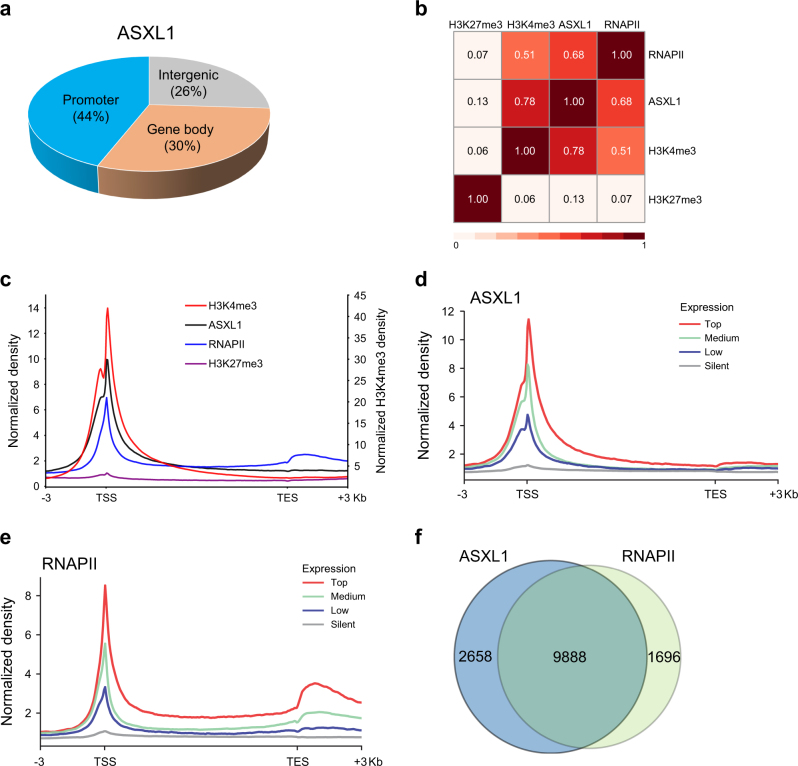
Fig. 5. ASXL1 co-localizes with RNAPII in BMSCs.
a Genomic distribution of ASXL1 peaks in WT BMSCs. b Heatmap showing a pairwise correlation between ASXL1, H3K4me3, H3K27me3, and RNAPII in WT BMSCs. Pearson correlation coefficients are given for each comparison. c Average genome-wide occupancies of H3K4me3 (red, right y-axis), ASXL1 (black), RNAPII (blue), and H3K27me3 (purple) on ASXL1-bound genes along the transcription unit in WT BMSCs. d, e ASXL1 (d) and RNAPII (e) occupancies across genes classified by expression. The gene body length is aligned by percentage from the TSS to transcription end site (TES). 3 kb upstream of TSS and 3 kb downstream of TES are also included. f Venn-diagram shows the overlap among target genes of ASXL1 with RNAPII in WT BMSCs

