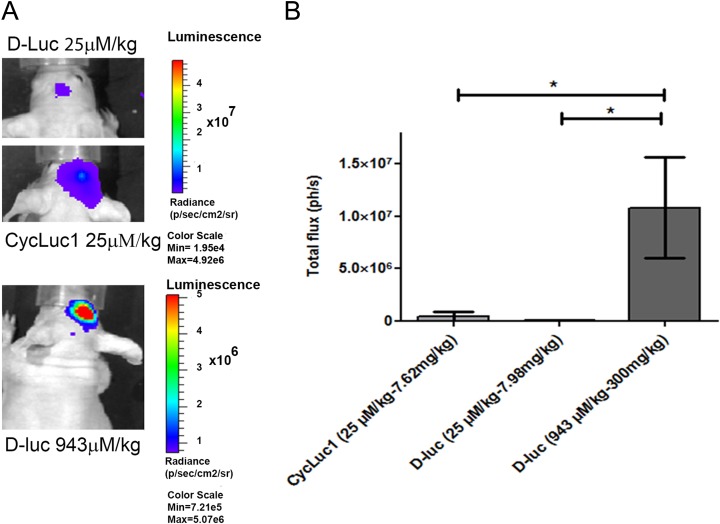
Fig. 6.
Bioluminescence imaging (BLI) signal in vivo of D-luciferin (D-Luc; 25 µM/kg), CycLuc1 (25 µM/kg), and D-Luc (943 µM/kg) in the mouse brain. (A; top) Injected with D-Luc (25 µM/kg), (middle) injected with CycLuc1 (25 µM/kg), and (bottom) injected with D-Luc (943 µM/kg) in mouse brain. (B) The graph showed that D-Luc (943 µM/kg) gives significantly higher BLI signals (∼1 × 10⁷) than D-Luc and CycLuc1 (25 µM/kg). Data are represented as mean (SD) (n = 3; *P ≤ 0.05).

