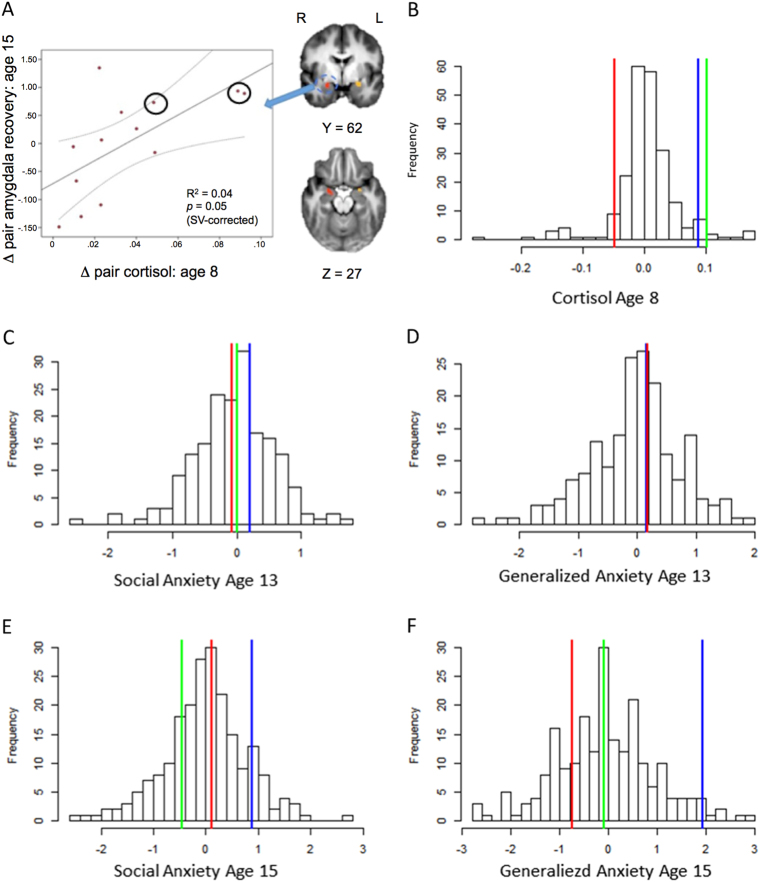
Fig. 1. Intrapair differences in childhood afternoon cortisol, amygdala function and behavior.
a The correlations between the intrapair differences in childhood cortisol (x axis) and amygdala-modulated recovery (y axis) are shown. Note: Twin pairs selected for whole genome epigenetic analysis are circled in black. b–f The distribution of the twin differences for the full sample is shown for HPA activity (cortisol level; b; N = 299) and anxious behaviors (c–f; N = 184 to 215). The selected pairs are indicated by color showing their relative twin difference compared to the full sample (pair A = green; B = red; C = green)

