Fig. 2.

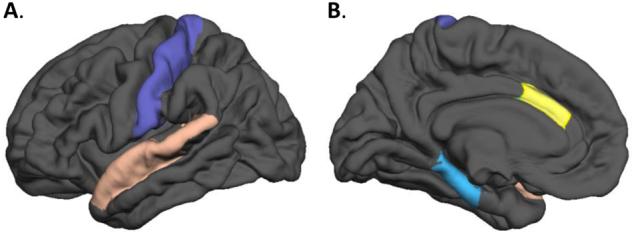
Illustration representing the four regions that showed smaller areas in PPE compared to NPPE. (a) Postcentral gyrus in purple and ACC in yellow. (b) Parahippocampal gyrus in blue and superior temporal gyrus (STG) in pink

Illustration representing the four regions that showed smaller areas in PPE compared to NPPE. (a) Postcentral gyrus in purple and ACC in yellow. (b) Parahippocampal gyrus in blue and superior temporal gyrus (STG) in pink