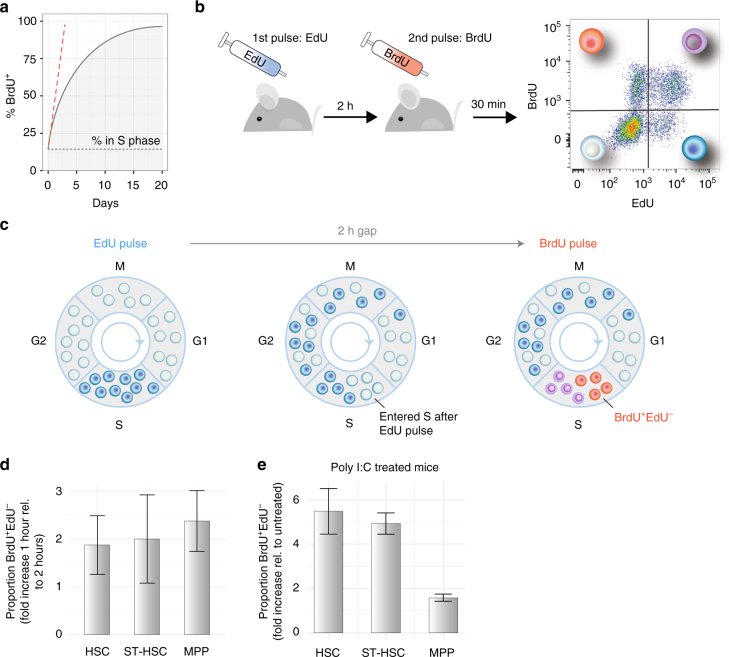
Fig. 2.
EdU and BrdU dual pulse allows measurement of rate of entry into S phase of haematopoietic cell populations. a Assuming a constant proportion of cells are in S phase (black dotted line), continuous administration of BrdU alone leads to progressive accumulation of the thymidine analogue in a growing proportion of the cell population (black line). The rate of entry in S phase at the time of the first administration is the derivative at the origin of the curve (dashed red line) and cannot be calculated from a single mouse. b Experimental setup: mice were administered EdU first, then BrdU 2 h later, and 30 min later were culled, and haematopoietic cells were analysed by flow cytometry. c Diagram representing the dynamics of cell labelling. EdU first labels all the cells in S phase (dark blue). In the 2-h gap, some of these cells progress through G2 and mitosis, while others continue to synthetise DNA (dark blue). In parallel, some unlabelled cells enter S phase (empty circles). BrdU again labels all the cells in S phase, with the following results: cells that entered S phase during the 2-h gap are BrdU single positive (orange circles), cells that were in S phase during both pulses are double positive (purple circles), and cells that terminated S phase prior to the BrdU pulse are EdU single positive (blue circles). d Validation of the dual-pulse method. A 2-h gap between pulses results in a 2-fold increase in the number of labelled cells compared to a 1-h pulse (shown is average ± s.e.m; p = 0.84 HSC, p = 0.99 ST-HSC, p = 0.61 MPP, Welch two-sample t-test; n = 3 mice with 1 h gap, and n = 3 mice with a 2 h gap). e Dual-pulse method can identify the changes in proliferation rate of cell populations. Mice were administered poly I:C prior to EdU and BrdU, 24 h prior to culling, and the proportions of S phase HSCs, ST-HSCs and MPPs were compared to those of control mice (average ± s.e.m shown; p = 0.04 HSC, p = 0.01 ST-HSC, p = 0.07 MPP, Welch two-sample t-test; n = 3 control and n = 3 poly I:C treated mice)

