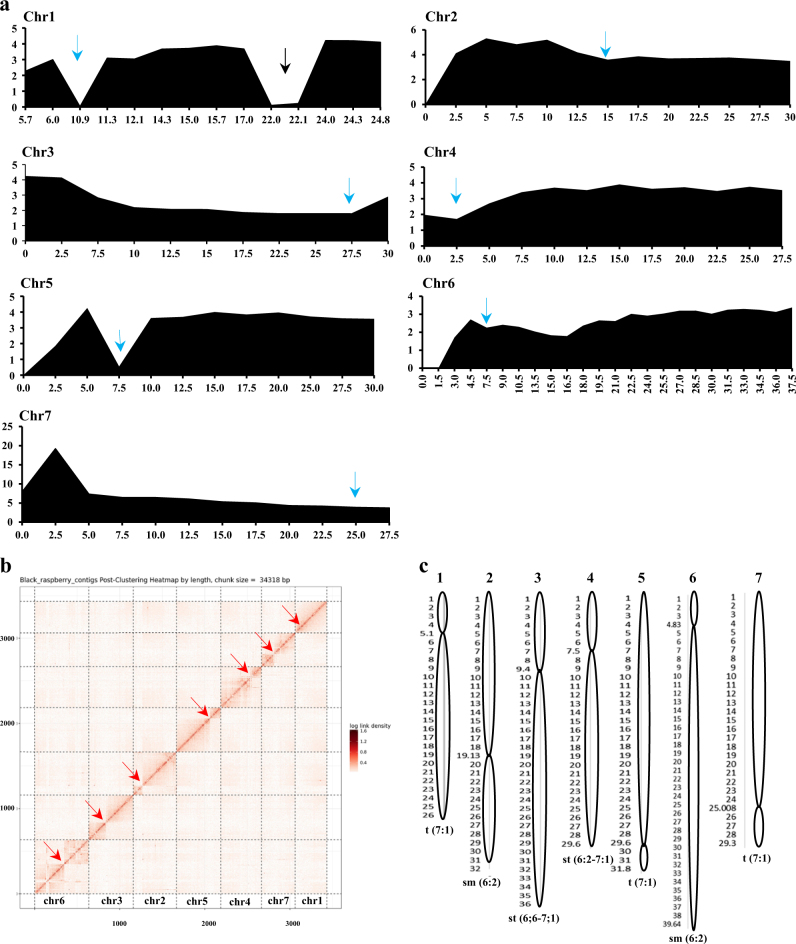
Fig. 3. Identification of centromeres in the Rubus_occidentalis_v1.0.pga genome assembly.
a Frequencies of genetic recombination in ORUS 4153–1 genome. The x-axis represents the physical distance in million base pairs (Mb) along the chromosomes. The y-axis represents the ratio of genetic distance to physical distance (cM/Mb) calculated from the map published by Bushakra et al.24 The average physical distance ranged from 2 to 4 Mb per cM across the chromosome, a dip in the recombination frequencies may correspond to centromere locations. The approximate centromere positions are marked with blue arrows. The black arrow represents a region of reduced recombination on chromosome 1. b Hi-C heat map showing the density of Hi-C interactions between scaffolds used for proximity-guided assembly. The seven pseudo-chromosomes are arranged by size with the largest clusters sorted towards the bottom left of the matrix. The submatrix shown here corresponds to intrachromosomal interactions in the genome. Each pixel represents all interactions between one 34.31 kb locus and another 34.31 kb locus and intensity corresponds to the total number of reads per interaction. The approximate centromere positions are marked with red arrow. c Physical maps of chromosomes showing R. occidentalis centromeric positions. Physical sizes of chromosomes were derived from Rubus_occidentalis_v1.1 assembly and chromosomes were classified by the method proposed by Naranjo et al.38 t terminal, sm submedian, st subterminal

