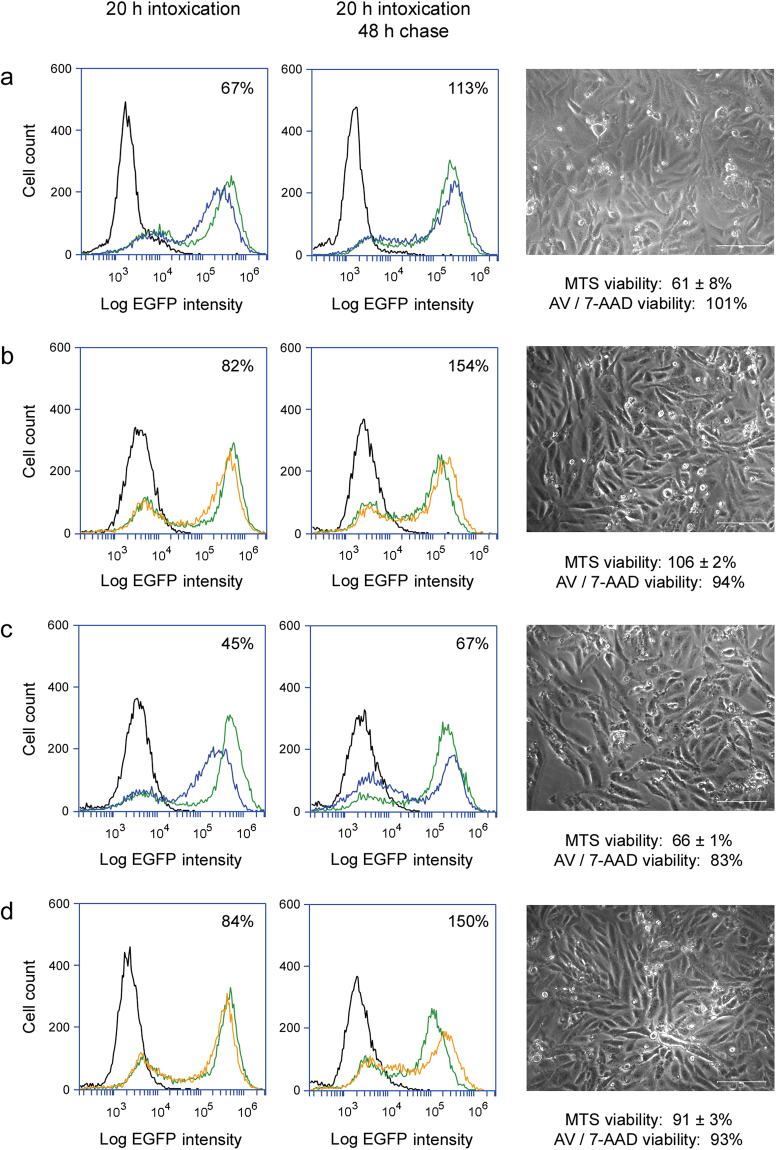
Figure 5.
Recovery from intoxication. Vero-d2EGFP cells were incubated with (a) 0.025 ng/mL of ricin, (b) 0.001 ng/mL of Stx1, (c) 1.0 ng/mL of EtxA, or (d) 0.01 ng/mL of Dtx for 20 h and then chased for 48 h in the absence of toxin. Blue and orange lines (corresponding to the color-coded toxin concentrations in Supplementary Figure S1) were generated from cytofluorometry analysis of toxin-treated Vero-d2EGFP cells at the end of the 20 h toxin incubation (left column) or 48 h chase (center column). Unintoxicated parental Vero cells (black lines) and unintoxicated Vero-d2EGFP cells (green lines) were also processed for each condition. Percentages represent the strength of the EGFP signal from intoxicated cells in comparison to unintoxicated cells. Right column: Representative images of cells at the end of the 48 h chase were taken at 200× magnification. Cell viability, as assessed by MTS assay (n = 3, avg. ± std. dev.) or annexin V (AV) / 7-AAD staining of the same cell population processed for EGFP cytofluorometry, is indicated.

