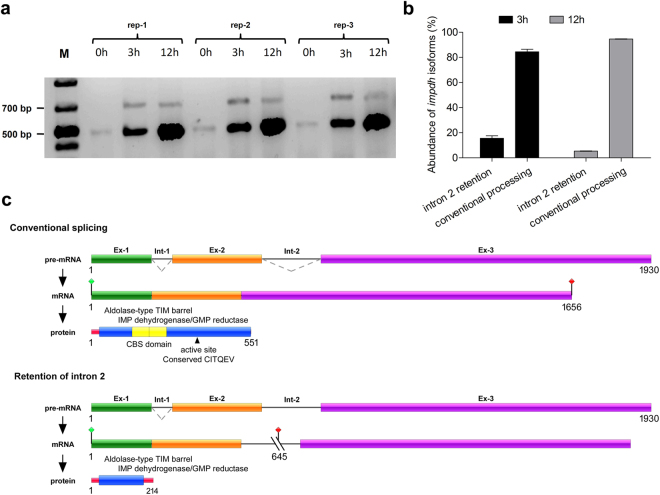
Figure 7.
Schematic representation of intron 2 retention in impdh gene in T. rubrum. (a) Retention of intron 2 during the pre-mRNA processing of the impdh gene as visualized by RT-PCR of T. rubrum exposed to UDA for 0 h (control), 3 h, and 12 h, assessed in three biological replicates. (M) Molecular weight ladder. The expected size of each amplicon was 481 bp for the elimination of intron 2 and 684 bp for the retention of intron 2. The full-length gel is presented in Supplementary Figure S3 (b) The PCR products were visualized in ImageJ software and subjected to densitometry analysis for determining the abundance for amplicons with retention of intron 2, and amplicons for conventional processing. The ratio of intron-2 retention corresponds to approximately 15:100 and 5:100 for 3 h and 12 h of UDA exposure, respectively. (c) Schematic representation of intron 2 retention, showing genomic DNA and the mRNA organization of the impdh gene of T. rubrum during conventional splicing, and alternative splicing promoted by intron 2 retention. Exons are shown as coloured boxes; introns are shown as solid lines. Dotted lines indicate the joining of exonic regions by the removal of introns from the sequence. A premature stop codon is indicated by cut lines followed by a red signal. The active site is indicated in residue 355.

