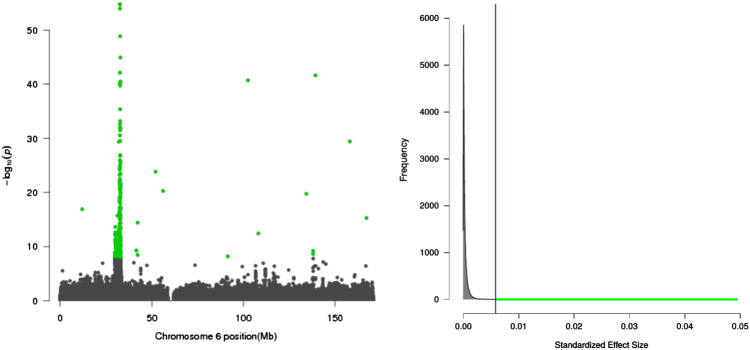
Fig. 3.
Complex diseases have intrinsically weak genetic effects, as illustrated by a Manhattan plot with only a few significant P-values highlighted in green color. The effect sizes corresponding to P-values in the Manhattan plot look “L-shaped,” reflecting the idea that the majority of signals are just noise with very little effect sizes (e.g., as measured by so the bulk of the effect size distribution is around zero and it is increasingly less likely to find a signal with a large effect size

