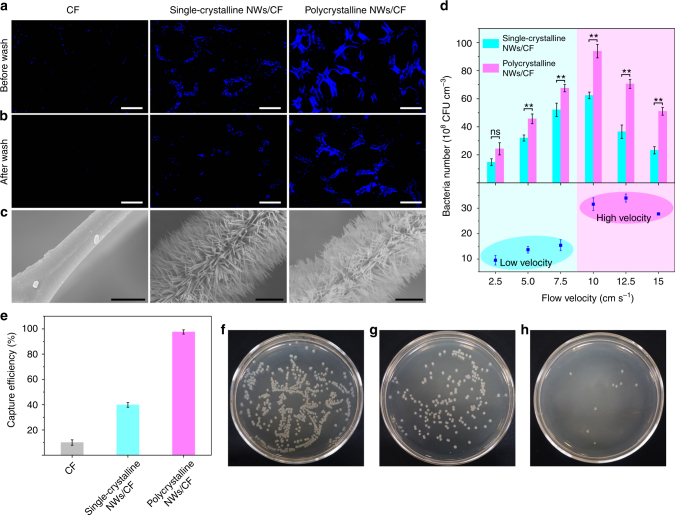
Fig. 5.
Bacteria capturing performance in the bloodstream. Fluorescent images of bacteria captured in three dialyzers a before and b after washing with sterile normal saline at a flow velocity of 20 cm s−1 for 2 min. The bacteria were stained with DAPI shown in blue. Scale bars in a and b are 100 μm. c Corresponding SEM images of the dialyzers after washing. Scale bars, 5 μm. d Quantitative evaluation of the number of captured bacteria using Con A-modified dialyzers at different flow velocities, and the difference in the number of bacteria captured between the dialyzers. e Bacterial capturing efficiencies of the three dialyzers. Bacteria spiked into adult human blood and flowed through the dialyzers at 10 cm s−1. f–h Photograph of an agar plate visualizing the residual bacteria among three dialyzers, including f CF, g single-crystalline NWs/CF, and h polycrystalline NWs/CF. Error bars: standard error (n = 3). Student’s t-test, **P < 0.01; ns, not significant

