Figure 2.
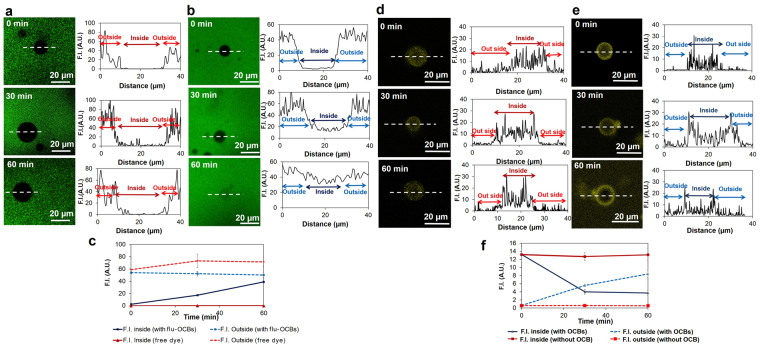
Liposome leakage. Penetration of flu-OCBs into liposomes (a,b and c): (a) Fluorescence images of liposomes after being incubated with flu (free dye molecules, in green) for 0, 30 and 60 min (left) accompanied with plots of fluorescence intensity (F.I.) along the dotted line of the corresponding liposomes (right), (b) Fluorescence images of liposomes after being incubated with flu-OCBs (in green) for 0, 30 and 60 min (left) accompanied with plots of F.I. along the dotted line of the corresponding liposomes (right), (c) Plots of F.I. at the inside and outside of the liposomes, as a function of incubation time (shown as mean ± SD). Anthocyanin leak from liposomes (d,e and f): (d) Fluorescence images of anthocyanin (pseudo-color, yellow) filled liposomes after being incubated with water for 0, 30 and 60 min (left) accompanied with plots of F.I. along the dotted line of the corresponding liposomes (right), (e) Fluorescence images of anthocyanin (pseudo-color, yellow) filled liposomes after being incubated with OCBs for 0, 30 and 60 min (left) accompanied with plots of F.I. along the dotted line of the corresponding liposomes (right), (f) Plots of anthocyanin F.I. at the inside and outside of the liposomes after water addition (without OCB) or OCBs addition (with OCBs), as a function of incubation time (shown as mean ± SD).

