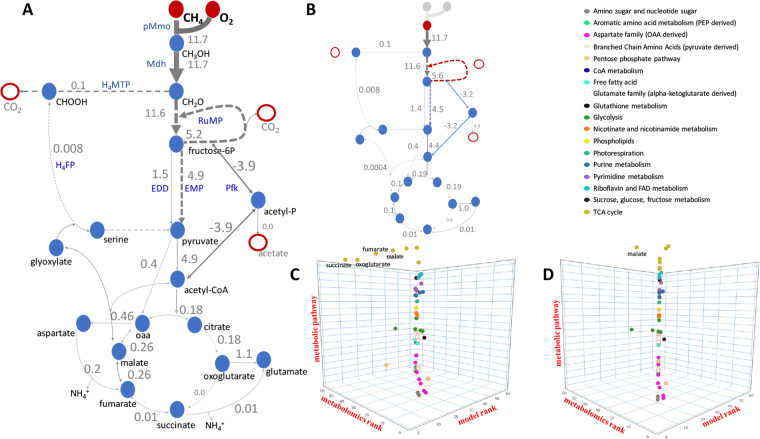
Figure 1.
Central metabolic pathways of methane (A) and methanol (B) utilization in Methylomicrobium alcaliphilum 20ZR and results of FBA analyses. Red circles indicate input substrates (CH4, O2, or CH3OH), White circles with red outlines indicate excreted compounds (CO2 and acetate); thickness of arrow represents predicted value of the corresponding flux via the reaction (solid arrow) or metabolic pathway (dotted arrows); (C,D) 3D plots of comparative analysis of metabolic profiling versus predicted flux ratios between the same growth conditions (axis X – model rank; axis Y – metabolomics rank; axis Z – metabolic pathway that a compound belongs to). (C) Comparison of results for complete TCA cycle (Spearman’s index equals to 0.9, p-value = 2.7E-24); (D) Comparisons of results for branched TCA cycle and reverse phosphoketolase reaction (R = 0.99, p-value = 2E-55).

