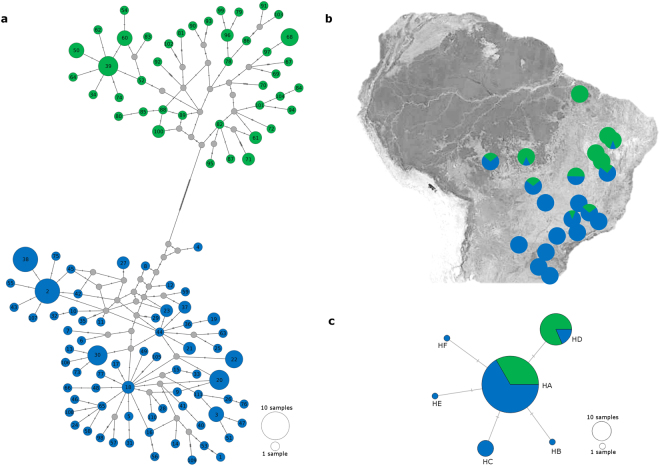
Figure 1.
Median-joining network and geographic distribution of Euschistus heros haplotypes in South America. (a) Network of 159 concatenated mitochondrial COI-Cytb sequences. Size of haplotype circles reflects sample size, and gray nodes represent missing haplotypes. Colors indicate the two mitochondrial lineages of haplotypes: lineage N (northern) in green, and lineage S (southern) in blue. Number of mutation steps is shown as hatch marks. (b) Geographic distributions of the mitochondrial haplotypes. Circles represent the proportion of each lineage. The map was obtained from Google Maps, Map ©2017 Google, INEGI. Pie charts were drawn with Microsoft Excel. Maps were modified with GIMP 2.8.22 (c) Network of 124 nuclear ITS1 region sequences. The haplotype color refers to the mitochondrial lineages of the individual from which the ITS1 sequence was obtained.

