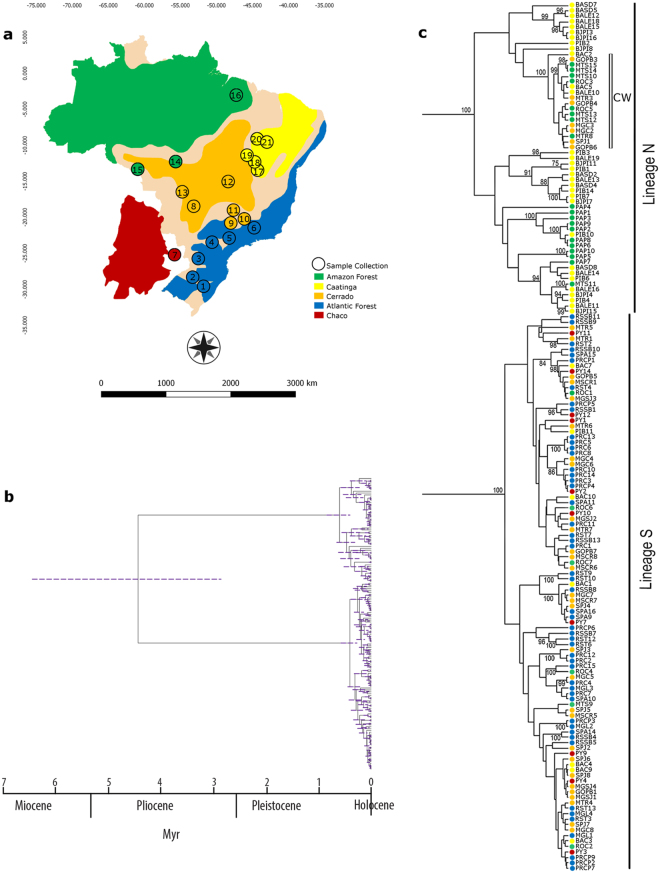
Figure 2.
Bayesian coalescent tree for Euschistus heros. (a) Geographic and biome distribution of each population of E. heros sampled (see Table 1) (map based on Ab’Saber77 and modified with GIMP 2.8.22); (b) Bayesian phylogeny tree of 159 concatenated mitochondrial sequences (COI-Cytb). Gray bars at nodes indicate 95% highest probability density intervals (HPD) confidence intervals for nodal age. (c) Bayesian phylogeny tree showing posterior probability values (>75) and biome where individuals were collected (taxon names provided in Table 1).

