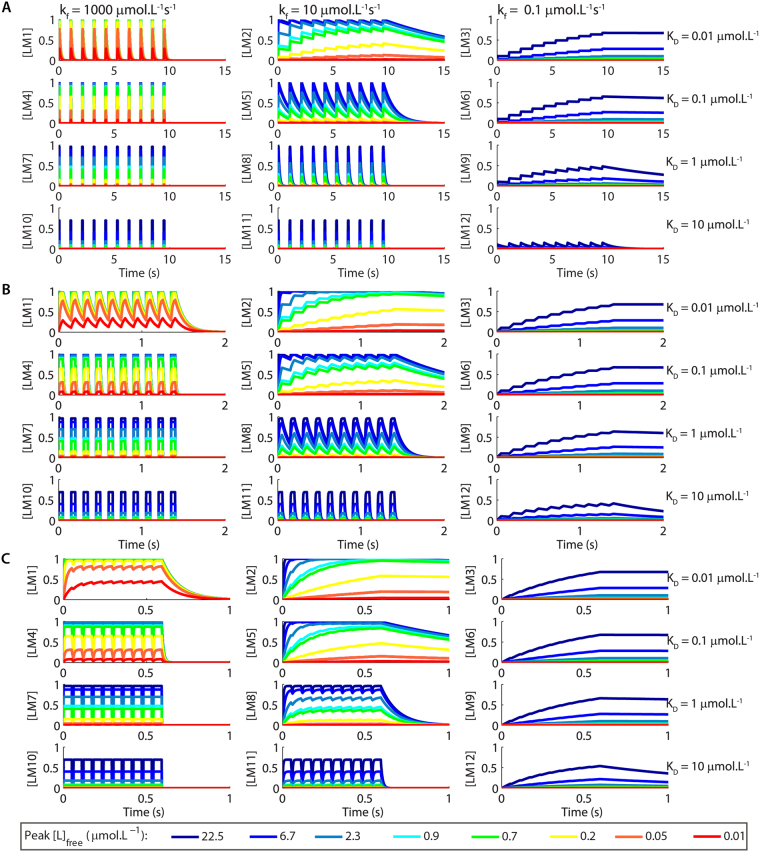
Figure 5.
Examples of the time courses for the formation of LM1-LM12 obtained using trains of ten pulses of [L]free with different peak amplitudes released at 1 Hz (A), 10 Hz (B), or 100 Hz (C). Each pulse of [L]free had 50 ms of duration. The time courses of [L]free are showed in Suppl. Fig. S1A–C. The control KDs for the interactions of M1-M12 with L are showed on the right of the panels and the kfs for the association reactions are indicated in A. The legend indicates the colour code used to represent each concentration of [L]free.

