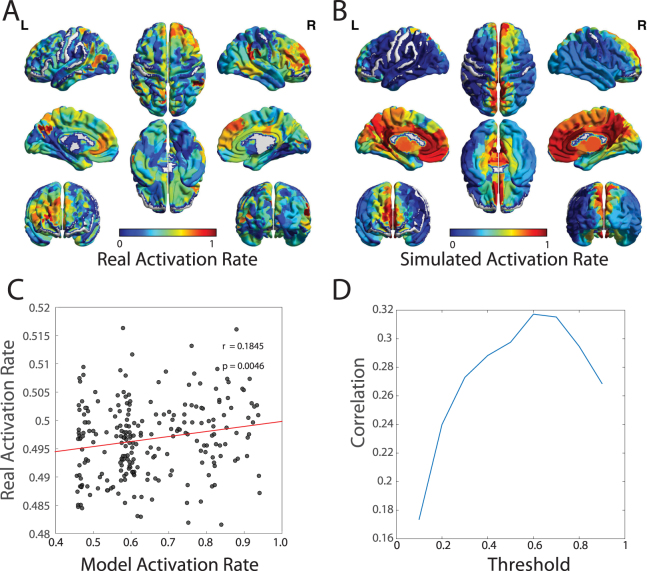
Figure 3.
Validating Predicted Activation Rates in Functional Neuroimaging Data. (A) From resting state BOLD data acquired in an independent cohort, we estimated the true activation rate by transforming the continuous BOLD magnitudes to binary state vectors by thresholding the signals at 0 (see Methods). We use these binary state vectors to estimate the activation rates of each brain region across the full resting state scan. Here we show the mean activation rate of each brain region, averaged over subjects. (B) For comparison, we also show the mean predicted activation rate estimated from the local minima of the maximum entropy model, as defined in Equation4, and averaged over subjects. (C) We observe that the activation rates estimated from resting state fMRI data are significantly positively correlated with the activation rates estimated from the local minima of the maximum entropy model (Pearson’s correlation coefficient r = 0.18, p = 0.00466). Each data point represents a brain region, with either observed or predicted activation rates averaged over subjects. (D) The positive correlation between activation rates estimated from the local minima of the maximum entropy model and the activation rates estimated from resting state fMRI were consistently observed across a range of thresholds for defining an “active” region in the BOLD data. The strongest correlation was observed at relatively high thresholds (r = 0.31, p-value of 1 × 10⁻¹⁰), indicating that the model we study is a particularly good predictor of patterns of highly activated regions in the resting state.

