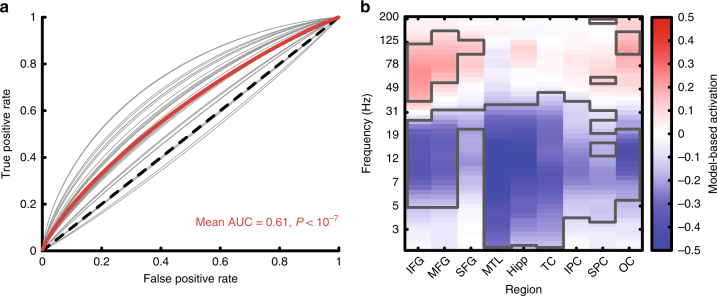
Fig. 2.
Classifier performance and features. a Receiver operating characteristic (ROC) curves showing performance of a record-only classifier tested on NoStim lists during the closed-loop sessions (gray lines). Each curve displays the ROC for a unique subject–stimulation site. The group average is shown in red (mean AUC = 0.61, P < 10−7 by a one-sample t-test, N = 29 unique stimulation targets). b Forward model-based estimates of feature importance. For each electrode region by frequency feature, we computed a forward model-based estimate of the feature’s contribution to the classification decision34. This analysis shows that the classifier used increased high-frequency power combined with decreased low-frequency power to predict successfully recalled words (clusters significant at the P < 0.05 level by a one-sample t-test are outlined in gray, N = 25 record-only classifiers)

