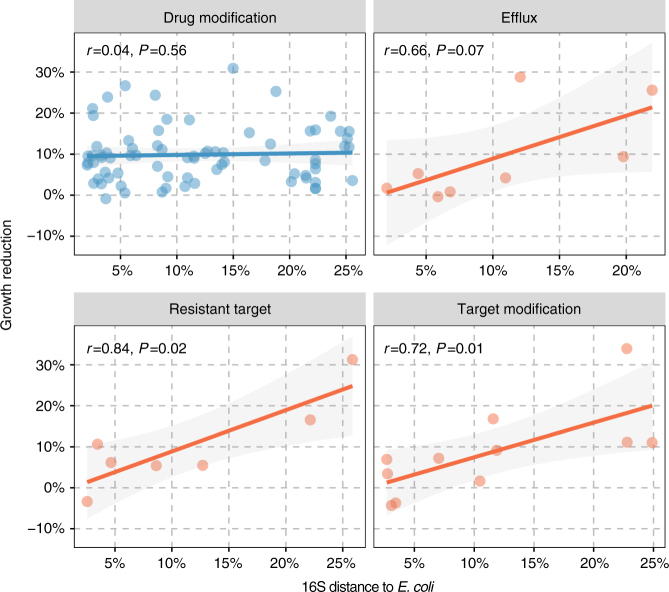
Fig. 6.
The correlation of the average 16S distance with the growth reduction imposed by genes of different mechanistic categories. There was no significant difference, in the observed correlations, between the cell-interacting categories (orange) in a multiple linear regression (ANOVA, P = 0.93). Regulators were excluded because this mechanistic category only contained one functional gene (cpxA). Shading represents the standard error of the linear fit and the Spearman correlation coefficients are shown

