Fig. 6.
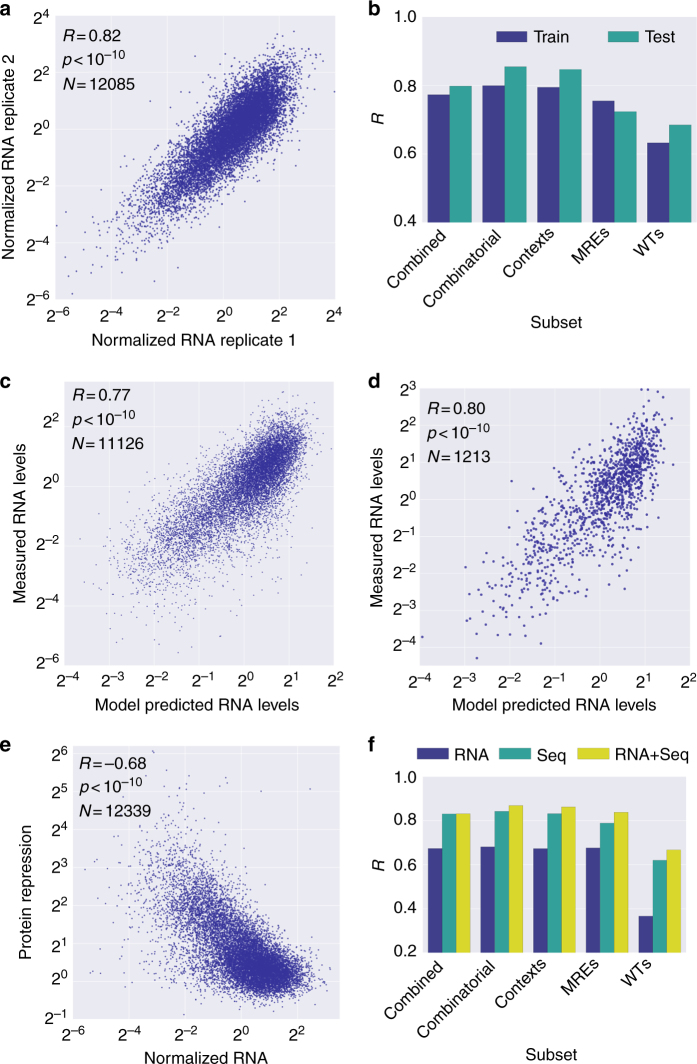
Incorporation of RNA levels into the model does not significantly improve model performance. a Scatter plot of RNA level measurement replicates from the genomically integrated reporter library. b Bar plot depicting model performance for predicting the RNA levels on training and test data. c Scatter plot of measured vs model-predicted normalized RNA levels on training data. d Scatter plot of measured vs model-predicted normalized RNA levels on test data. e Scatter plot of measured protein repression levels vs measured normalized RNA expression levels. f Comparison of model performances for predicting protein repression based on different training data. “RNA” refers to a model that used measured normalized RNA levels as the single input feature. “Seq” refers to the model that used the MRE-based features as in Fig. 5a. “RNA + Seq” refers to a model that used both the MRE-based features and the measured normalized RNA levels as input features

