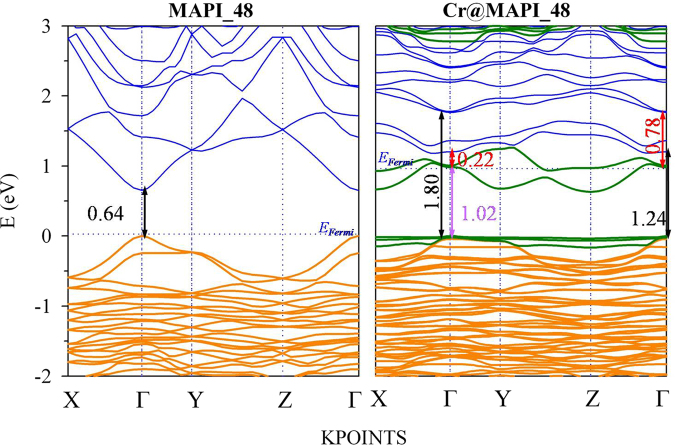
Figure 4.
Projected band structure of MAPI_48 and Cr@MAPI_48 perovskites calculated with PBEsol+SOC along to main energy differences measured at Γ point (black, violet and red stand for VB-CB, VB-IGB and IGB-CB energy differences, respectively). Orange, Blue and Green colors stand for the main contribution of I, Pb and Cr atoms. The zero of energy has been set at the valence band energy, while blue dotted line is representing the Fermi level (EFermi).

