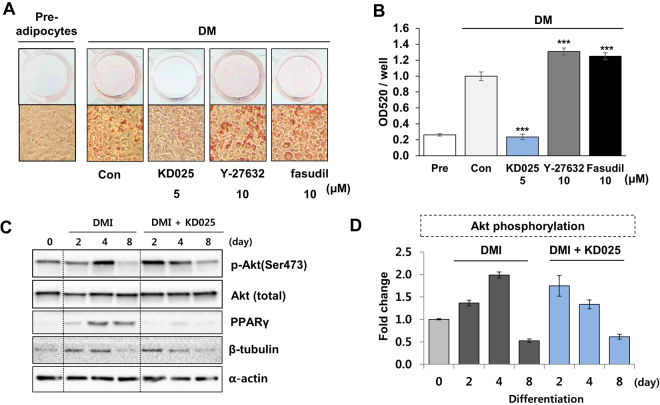
Figure 5.
Effects of ROCK inhibitors on insulin action and signaling. (A) 3T3-L1 cells were differentiated through incubation in DM (without insulin) with KD025, Y-27632, or fasudil, as previously indicated, and stained with Oil Red O on day 8. (B) Lipid accumulation was assessed by measuring the absorbance at 520 nm of Oil Red O. ***p < 0.001 vs. DM control. (C,D) 3T3-L1 cells were differentiated in DMI-containing media with or without KD025 for 2, 4, or 8 days. (C) Cells lysates were subjected to SDS-PAGE and immunoblotted with anti-phospho-Akt (Ser473) and total Akt antibodies. PPARγ was used as a differentiation marker, and β-tubulin and α-actin as loading controls. (D) The level of phosphorylated Akt at Ser473 residue was illustrated during adipogenesis. *p < 0.05; **p < 0.01; ***p < 0.001 vs. insulin + vehicle untreated. The data are the representative from more than three independent experiments. Data are expressed as means ± S.E. based on triplicate.

