Figure 6.
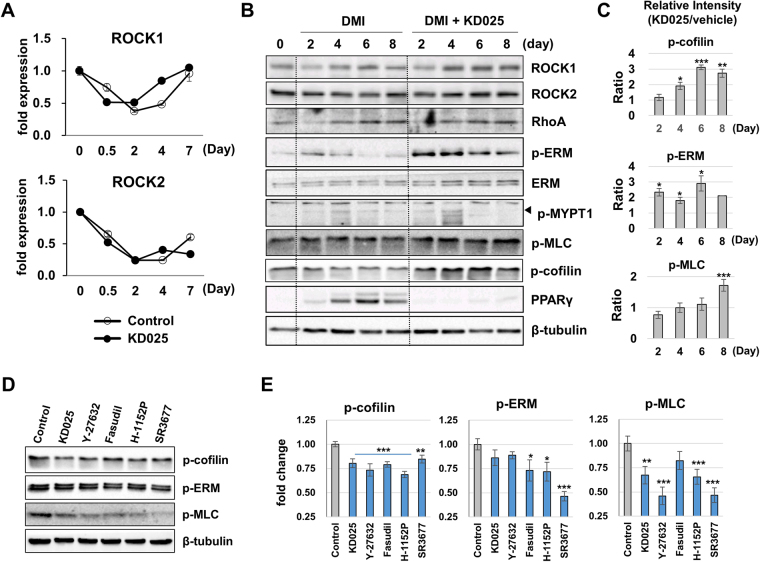
Regulation of ROCKs during adipogenesis. (A–C) 3T3-L1 cells were differentiated through incubation in DMI with or without KD025 for the indicated time points. (A) mRNA expression levels of ROCK1 and ROCK2 were measured by qRT-PCR. (B) Protein expression levels of ROCK1, ROCK2, p-cofilin, p-MLC, p-MYPT1, p-ERM, ERM and RhoA were analyzed by immunoblot. PPARγ was used as a marker of adipogenesis and β-tubulin as a loading control. (C) The relative intensity of phosphorylation levels of cofilin, ERM, and MLC were compared between vehicle- and KD025-treated conditions. *p < 0.05; **p < 0.01; ***p < 0.001 vs. the corresponding control. (D,E) 3T3-L1 pre-adipocytes were treated with KD025 (7 µM), Y-27632 (10 µM), fasudil (10 µM), H-1152P (3 µM), or SR3677 (5 µM) for one day. The phosphorylation levels of cofilin, ERM, and MLC were measured by immunoblot. β-tubulin was used as a loading control. *p < 0.05; **p < 0.01; ***p < 0.001 vs. vehicle-treated. The data are the representative from more than three independent experiments. Data are expressed as means ± S.E. based on triplicate.

