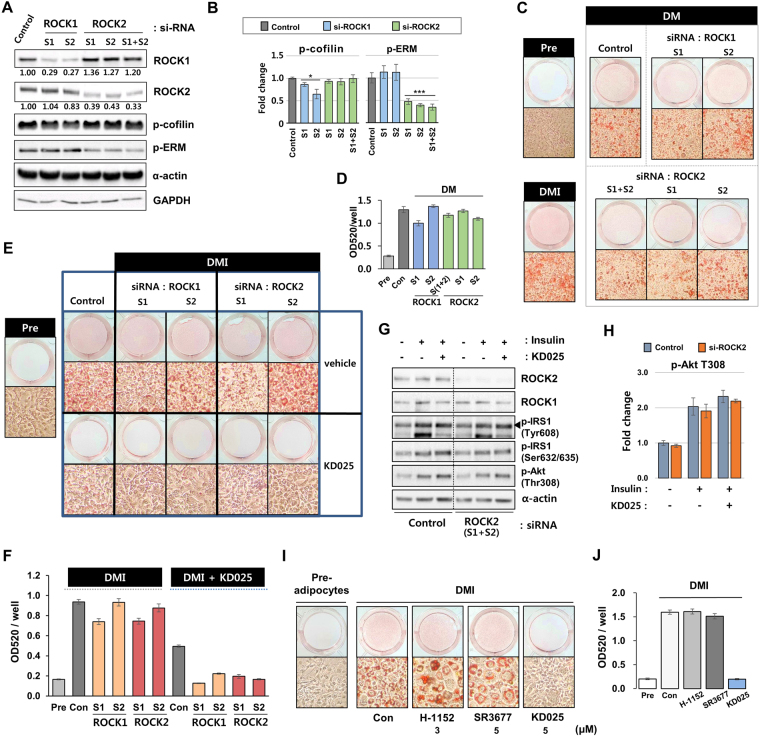
Figure 7.
ROCK-independent action of KD025 on adipogenesis. (A,B) 3T3-L1 cells transfected with two different sequences (S1 and S2) of ROCK1 or ROCK2 siRNA and incubated for 2 days to reach confluence. (A) Cell lysates were subjected to SDS-PAGE and analyzed using anti-ROCK1 and anti-ROCK2 antibodies to see the depletion of each isoform. The phosphorylation levels of cofilin and ERM were measured using phospho-specific antibodies. GAPDH and α-actin were used as loading controls. (B) The phosphorylation level change of cofilin and ERM by gene knockdown of ROCK 1 and 2 was depicted as fold changes. *p < 0.05; **p < 0.01; ***p < 0.001 vs. vehicle-transfected. (C and D) Transfected cells were grown to confluence and maintained for 2 days and then differentiated through incubation with DM-containing medium for 8 days. (C) Cells were stained with Oil Red O. Macroscopic and microscopic pictures of cells are shown. (D) Lipid accumulation was assessed by measuring absorbance at 520 nm of Oil Red O. (E–G) Transfected cells with ROCK siRNAs were differentiated through incubation with DMI for 8 days with or without KD025 (5 µM). (E) Cells were stained with Oil Red O. Macroscopic and microscopic pictures of cells are shown. (F) Lipid accumulation was assessed by measuring absorbance of Oil Red O. (G,H) Insulin signaling pathway was inspected with lysates from ROCK2 knocked-down pre-adipocytes cells (S1 + S2) with or without KD025 treatment. Immunoblot analysis was undergone with antibodies for phospho-IRS-1 (Tyr608 and Ser632/635), phospho-Akt (Thr308), Akt, ROCK1, and ROCK2. α-actin was used as a loading control. The relative level of p-Akt (Thr308) was assessed as fold changes compared to insulin-/KD025-untreated control cells. (I,J) The effect of H-1152 and SR3677, potent ROCK inhibitors, was analyzed on 3T3-L1 differentiation. (G) Cells were stained with Oil Red O and microscopic images are displayed. (H) Lipid accumulation was assessed of Oil Red O. The data are the representative from more than three independent experiments. Data are expressed as means ± S.E. based on triplicate.

