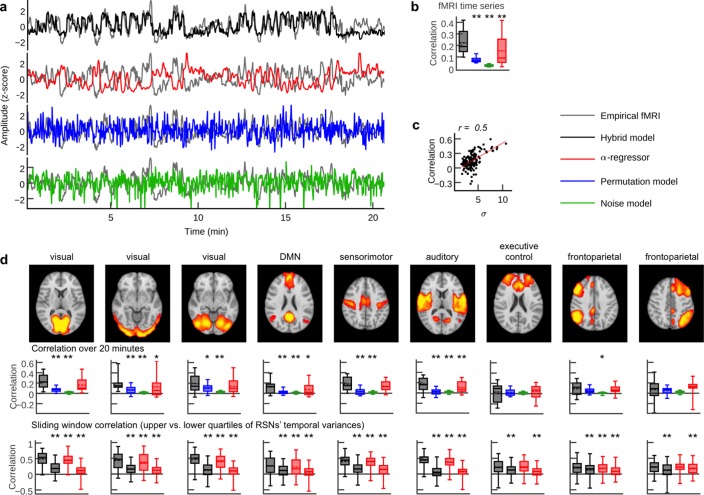
Figure 3. Person-specific fMRI time series prediction.
(a) Example time series of the hybrid model and the three control scenarios from one subject. (b) Box plots of average correlation coefficients between all simulated and empirical region time series (20.7 min) for each subject (n = 15; α-regressor values were inverted for illustration purposes). (c) Scatter plot of RSN time course standard deviation (s.d.) versus prediction quality. Dots depict data from the nine RSN time courses for each subject. (d) Comparison of prediction quality during upper versus lower quartile of epoch-wise RSN time course s.d.s. Upper row: spatial activation patterns of nine RSNs. Middle row: correlation coefficients between RSN temporal modes and hybrid model simulation results and the three control scenarios. Lower row: sliding window (length: 100 fMRI scans = 194 s; step width: one fMRI scan) correlations for the upper (first and third boxplot per panel) and lower quartiles (second and fourth boxplot per panel) of window-wise RSN temporal mode for the hybrid model and the α-regressor. Asterisks indicate significantly increased prediction quality of the hybrid model compared to control scenarios in one-tailed Wilcoxon rank sum test (*p<0.05, **p<0.01). Additionally, all hybrid model correlations in (b) and (d) were tested for the null hypothesis that they come from a distribution whose median is zero at the 5% significance level. All tests rejected the null hypothesis of zero medians except for RSN correlations over 20 min for the executive control and the frontoparietal networks (middle row).


