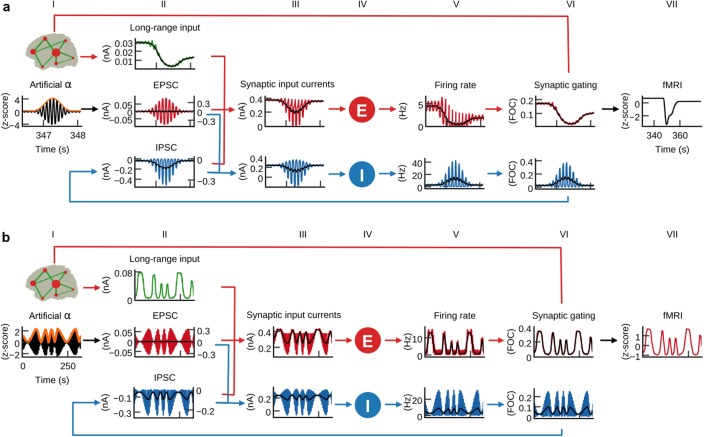
Figure 6. α-power fluctuations generate fMRI oscillations.
Grand average waveforms of population inputs and outputs on longer time scales. (a) Hybrid models were injected with artificial α-activity consisting of 10 Hz sine oscillations that contained a single brief high-power burst (black, column I; orange: signal envelope). While positive deflections of the α-wave generated positive deflections of inhibitory population firing rates, large negative deflections were bounded by the physiological constraint of 0 Hz (blue, fifth column; black: moving average). (b) Hybrid models were injected models with 10 Hz sine waves where ongoing power was modulated similar to empirical α-rhythms (0.01–0.03 Hz). Similarly to (a), but for a longer time frame, inhibitory populations rectified negative deflections, which introduced the α-power modulation as a new frequency component into firing rates and fMRI time series.
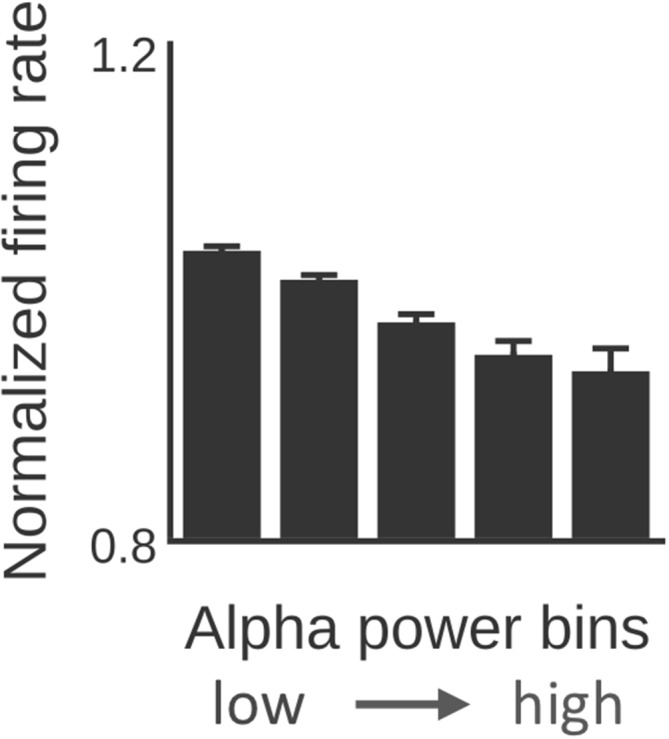
Figure 6—figure supplement 1. α-power predicts firing rate.


