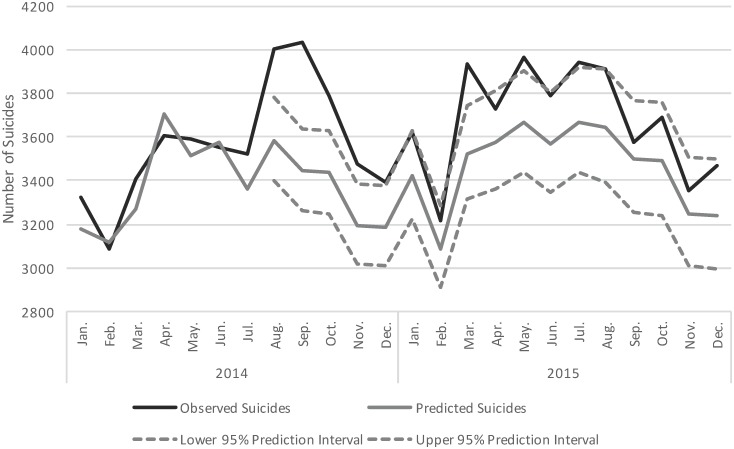
Fig 3. Number of observed and predicted suicide deaths in the United States from January 2014 to December 2015.
Number of observed suicide deaths (black line) and number of predicted suicide deaths (grey line) with 95% prediction intervals (dashed grey lines) are presented. The 95% prediction intervals are presented for the months following the death of Robin Williams in August, 2014.

