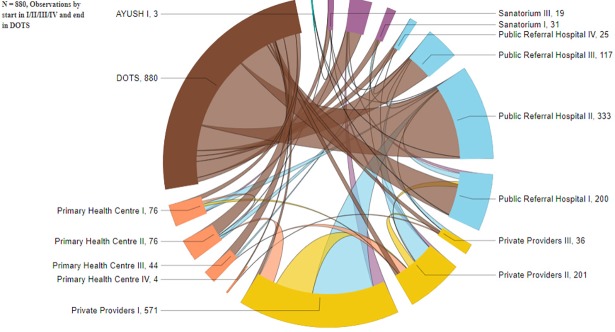
Fig 2. Chord diagram showing patients’ pathways to different health facilities prior to DOTS initiation in primary health centres under RNTCP, India.
Chord diagram shows the inter-relationships between patient’s pathways to different health facilities in order of I/ II/ III/ IV towards DOTS, the volume at each facility is presented in numbers and the matrix with different colours indicates the pathway relationship. Interactive link https://app.powerbi.com/view?r=eyJrIjoiM2FjNzJiMmUtNDVjNy00YTNkLTgwZjMtNGQzOTI0NzYwOTk0IiwidCI6IjdlNzgyYTc2LWUzZTQtNDQ1Ny04YzQzLWQ1NDVjNmRkYjUwZSJ9.

