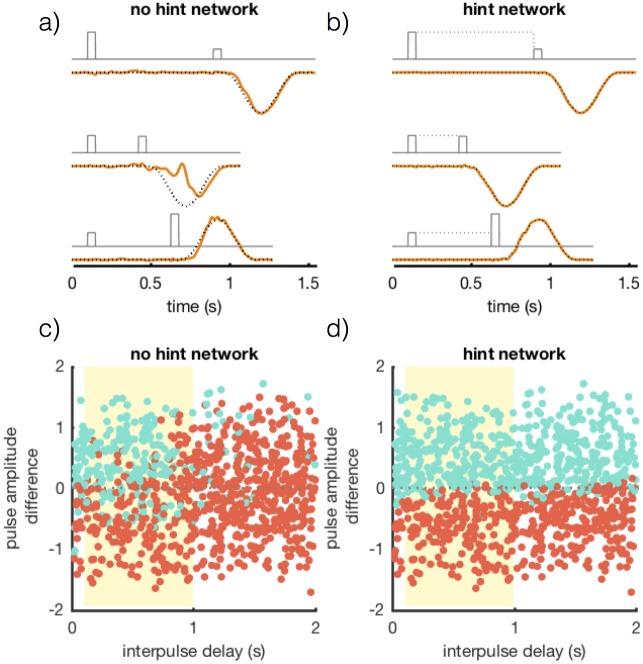
Fig 8. Performance results for networks trained on the delayed comparison task.
(a & b) fin(t) (grey), fhint(t) (grey dotted), fout(t) (black dotted) and z(t) (orange) for a network of 1000 units. Networks trained with full-FORCE learning without (a) and with (b) hints. Three different trials are shown from bottom to top: an easy “ + ” trial, a difficult “-” trial, and an easy “-” trial. (c & d) Test performance for networks trained without (c) and with (d) a hint. Each dot indicates a test trial and the dot color indicates the reported output class (“ + ” cyan or “-” red). The horizontal axis is the interpulse delay and the yellow region indicates the training domain. The vertical axis indicates the pulse amplitude difference.

