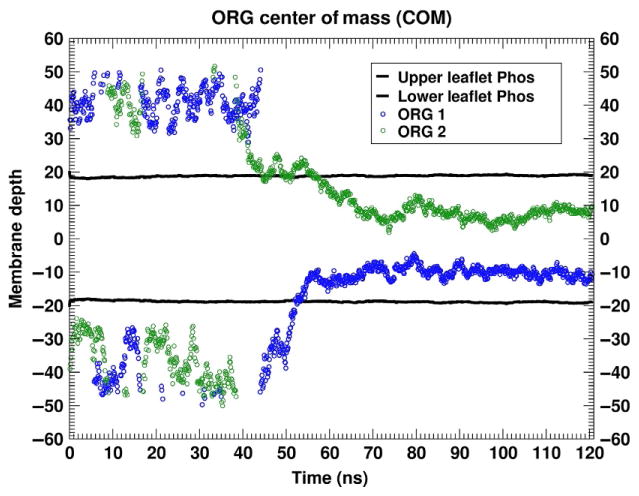
Fig. 10.
Time series of the partitioning of ORG27569 from water into POPC. This figure illustrates the time series of the center of mass of the two ORG27569 molecules relative to the average location of the POPC phosphorus atoms. The black lines are the locations of the upper (positive membrane depth) and lower (negative membrane depth) leaflet P atoms, while the green and blue symbols are the COM of the individual ORG27569 molecules.

