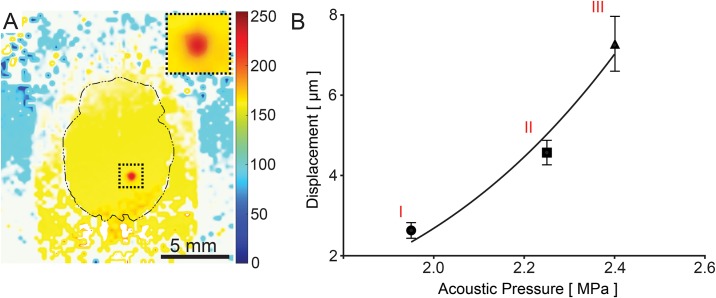
Fig 4. Confirmation of targeting in vivo by MR-ARFI imaging.
(A) MR-ARFI color map generated by post-processing the MR planes following sonication. Inset depicts sonicated region under higher magnification. (B) Brain tissue displacements generated by MRgFUS pulses and measured by MR-ARFI imaging at acoustic pressures of (I) 1.95 MPa, (II) 2.25 MPa, and (III) 2.4 MPa (n = 5 per acoustic pressure). Error bars represent standard deviation.

